
Media publishers are some of DebugBear's most enthusiastic users, using our powerful web performance analytics suite to monitor and improve page speed across dozens of websites. After all, it's an industry where every SEO advantage and pageview matters.
So in this series of articles, we'll be diving into the metrics of different content verticals to see how page speed drives performance for media publishers in the real world. Today: gaming websites!
Our web performance study
We analysed 48 different gaming websites from around the world. They include sites published by major publishing groups like Future, ZiffDavis, Webedia and Valnet, as well as independent sites like XGN, Video Chums and Stevivor. (View the full dataset.)
For each site, we used DebugBear to test their homepages as well as article pages, on both desktop and mobile devices, as well as revealing each domain's current performance in Google's CrUX dataset. We used DebugBear's bulk add function to import the target URLs into a Lab Test dashboard – you can see that here.
For the analysis below, we averaged the results we found across multiple tests.
The leaderboard
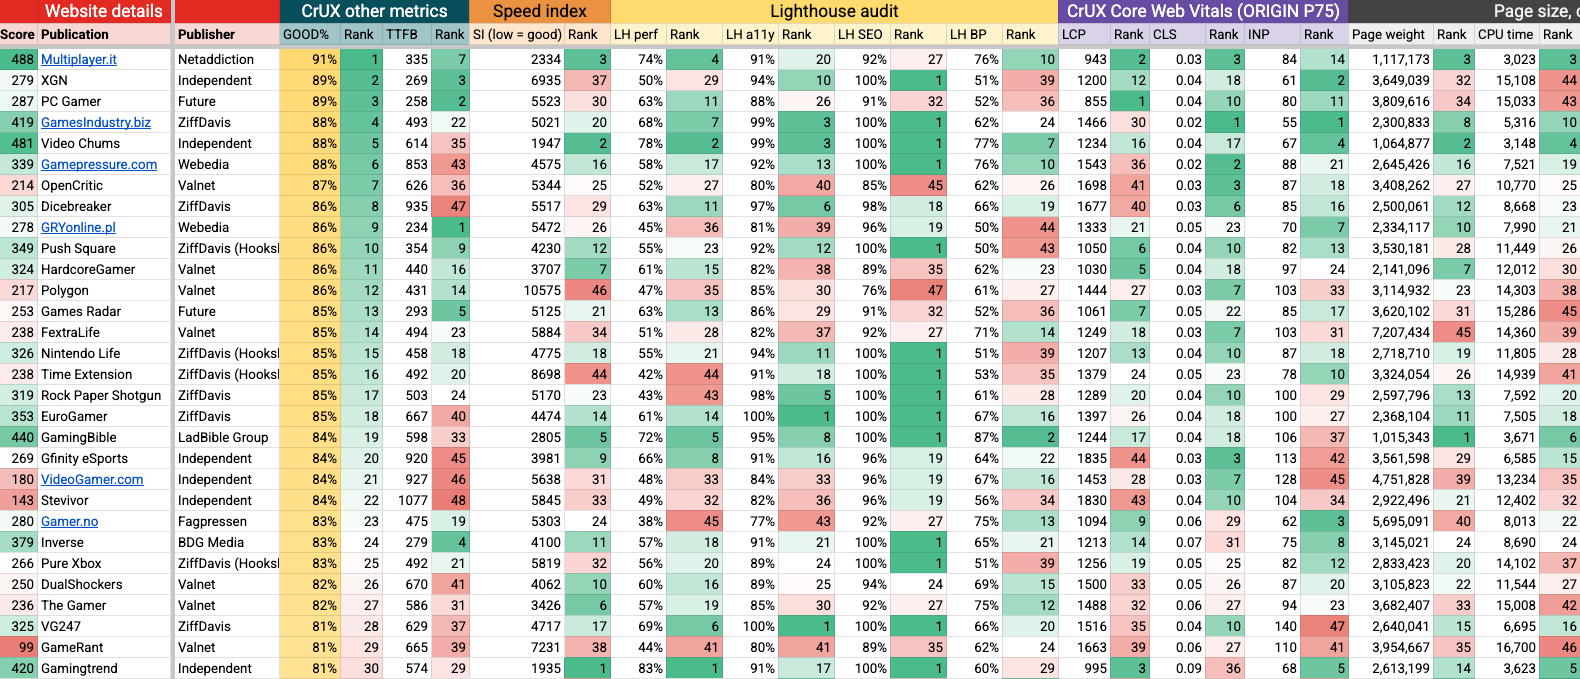
With so many web performance metrics, we needed to decide how to rank these websites: Speed index? Lighthouse performance score? Largest Contentful Paint? Or perhaps our own custom blend of the dozens of different performance metrics we capture?
Ultimately, we care about real-world results, and we do know that Google expects 75% of users to have a 'good' experience based on their Core Web Vitals metrics – and that performance below this can affect SEO results. So we've ranked our contenders by what percentage of users tha are likely to enjoy a 'good' performance by all three Core Web Vitals.
| Publication | Publisher | % users experiencing good CWV |
|---|---|---|
| Multiplayer.it | Netaddiction | 91% |
| XGN | Independent | 89% |
| PC Gamer | Future | 89% |
| GamesIndustry.biz | ZiffDavis | 88% |
| Video Chums | Independent | 88% |
| Gamepressure.com | Webedia | 88% |
| OpenCritic | Valnet | 87% |
| Dicebreaker | ZiffDavis | 86% |
| GRYonline.pl | Webedia | 86% |
| Push Square | ZiffDavis (Hookshot) | 86% |
| HardcoreGamer | Valnet | 86% |
| Polygon | Valnet | 86% |
| Games Radar | Future | 85% |
| FextraLife | Valnet | 85% |
| Nintendo Life | ZiffDavis (Hookshot) | 85% |
| Time Extension | ZiffDavis (Hookshot) | 85% |
| Rock Paper Shotgun | ZiffDavis | 85% |
| EuroGamer | ZiffDavis | 85% |
| GamingBible | LadBible Group | 84% |
| Gfinity eSports | Independent | 84% |
| VideoGamer.com | Independent | 84% |
| Stevivor | Independent | 84% |
| Gamer.no | Fagpressen | 83% |
| Inverse | BDG Media | 83% |
| Pure Xbox | ZiffDavis (Hookshot) | 83% |
| DualShockers | Valnet | 82% |
| The Gamer | Valnet | 82% |
| VG247 | ZiffDavis | 81% |
| GameRant | Valnet | 81% |
| Gamingtrend | Independent | 81% |
| PCgames.de | Marquard Group | 79% |
| HobbyConsolas | Henneo | 78% |
| AVERAGE | 79% | |
| GameOver | Independent | 78% |
| Maxroll | ZiffDavis | 77% |
| Vida Extra | Webedia | 75% |
| 3D Juegos | Webedia | 75% |
| JV | Webedia | 74% |
| Meinmmo | Webedia | 74% |
| IGN | ZiffDavis | 72% |
| JeuxActu | Webedia | 70% |
| GameBlog.fr | eBorealis | 68% |
| Gamestar | Webedia | 65% |
| Gamespot | Fandom. Inc. | 65% |
| Gamepro | Webedia | 65% |
| Cubed3 | Independent | 64% |
| Buffed | Marquard Group | 59% |
| PlayStation Universe | Independent | 57% |
| Atomix | Prowell Media | 51% |
Our take
Sites are loading fast
Good news: 100% of the sites we tested had Good scores for Largest Contentful Paint and Interaction to Next Paint metrics, no doubt the result of a lot of dedicated performance improvements and best practice behind the scenes. Well done, everybody.
Third parties don't need to be a problem
Interestingly, we didn't find that a large number of third party integrations affected performance. For example, XGN had the third-most third party requests (88 in total), and seeks permissions for 2227 (!) advertising partners on first visit, but still ranked second overall for performance.
Cumulative Layout Shift is publishers' main issue
11 of the 48 websites received 'Needs Improvement' or 'Poor' scores for Cumulative Layout Shift – that's the phenomenon where page content jumps around as new assets are downloaded and rendered.
For these sites, this is a serious issue, as CLS is one of Google's three Core Web Vitals, and a user must have a satisfactory score for all three metrics to have a Good experience overall. As a result, all 11 of these sites also have fewer than 75% of visits rated 'Good', which is the threshold below which Google may impose search penalties.
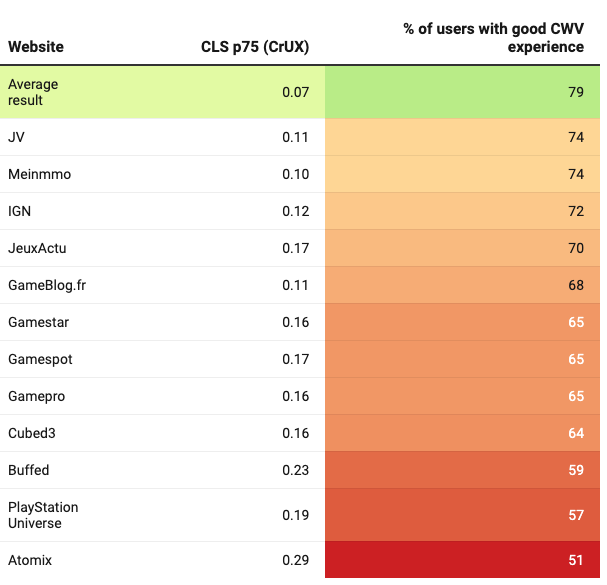
Gaming sites that might currently be receiving a search penalty
In this table, we can see that having a CLS score above 0.1 is closely related to having a sub-75% Good score in CrUX.
Get to grips with these issues with our in-depth guides: How To Fix Cumulative Layout Shift Issues and How To Avoid Large Layout Shifts: 3 Practical Examples.
Performance case study: optimized vs. not-so-optimized
Let's compare two contrasting websites from our analysis: Multiplayer.It, published by the Italian media group Netaddiction, and Atomix, published by the Mexican company Prowell Media. Here's how they stack up - the relative rank for that site on each metric is in (brackets):
| Website | Multiplayer.it | Atomix |
|---|---|---|
| Speed Index | 2334.25(3) | 13084.75(48) |
| Lighthouse performance score | 73.75%(4) | 36.75%(46) |
| Time to First Byte | 0.34s(7) | 0.63s(38) |
| Largest Contentful Paint (p75) | 0.94s(2) | 2.13s(47) |
| Cumulative Layout Shift | 0.03(3) | 0.29(48) |
| % of 'Good' visits | 91%(1) | 51%(48) |
| Average page weight | 1.1MB(3) | 10.2MB(48) |
| Console errors | 0 | 45 |
We can use the rich data available in DebugBear to dig into what's causing Atomix to have comparatively worse results, and fix things quickly.
The layout is not holding space for banner ads
Like other pages in our study, the key metric holding Atomix back is Cumulative Layout Shift.
Using DebugBear's filmstrip view of a typical page loading, we can see, step-by-step, what happens as the page loads. Watch that headline go!

Notice how the body copy is also pushed off-screen altogether. The reason is clear: ads! Pages on Atomix typically feature one or more ad units above the fold, but the template does not hold space for them in advance.
When they finally load, they push all the content beneath then down, causing the layout shift that is damaging the overall Core Web Vitals score.
This is a design challenge for all media publishers, as ads of various sizes may be served programmatically – and sometimes no ad is served at all. On Atomix, for example, both skinny leaderboard and thicker billboard ad units are candidates for display:

Nonetheless, a predictable layout with pre-defined spaces for incoming ads is a must to fix this problem.
The homepage content carousel is serving VERY large images
We analysed another 50 URLs from Atomix, and found that the average page weight is 4.8MB – substantial, but not jawdropping.
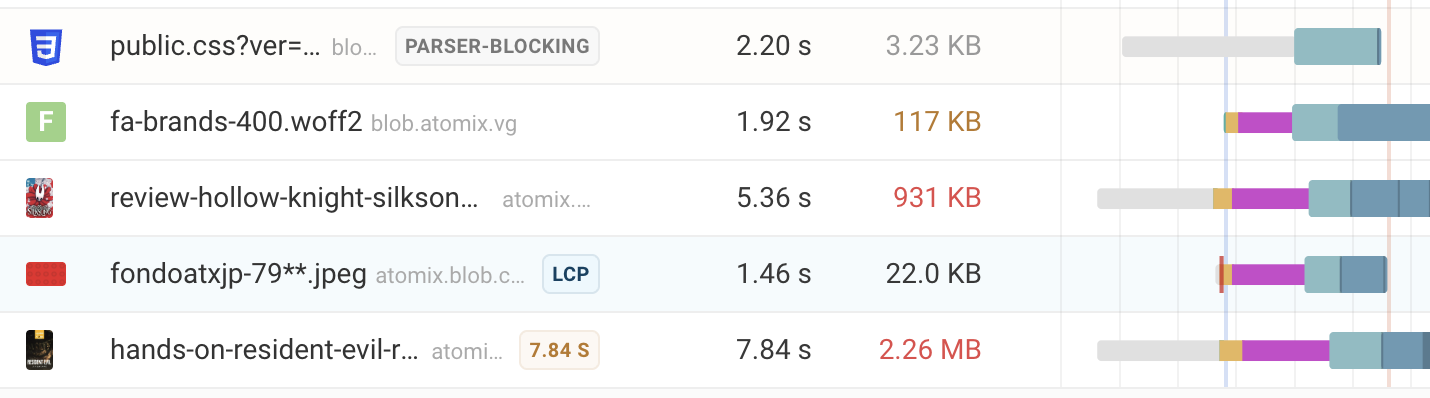
The homepage is a different story – a mighty 34MB, and the heaviest page we found among hundreds of URLs tested. To learn more, we took a look at the request waterfall:
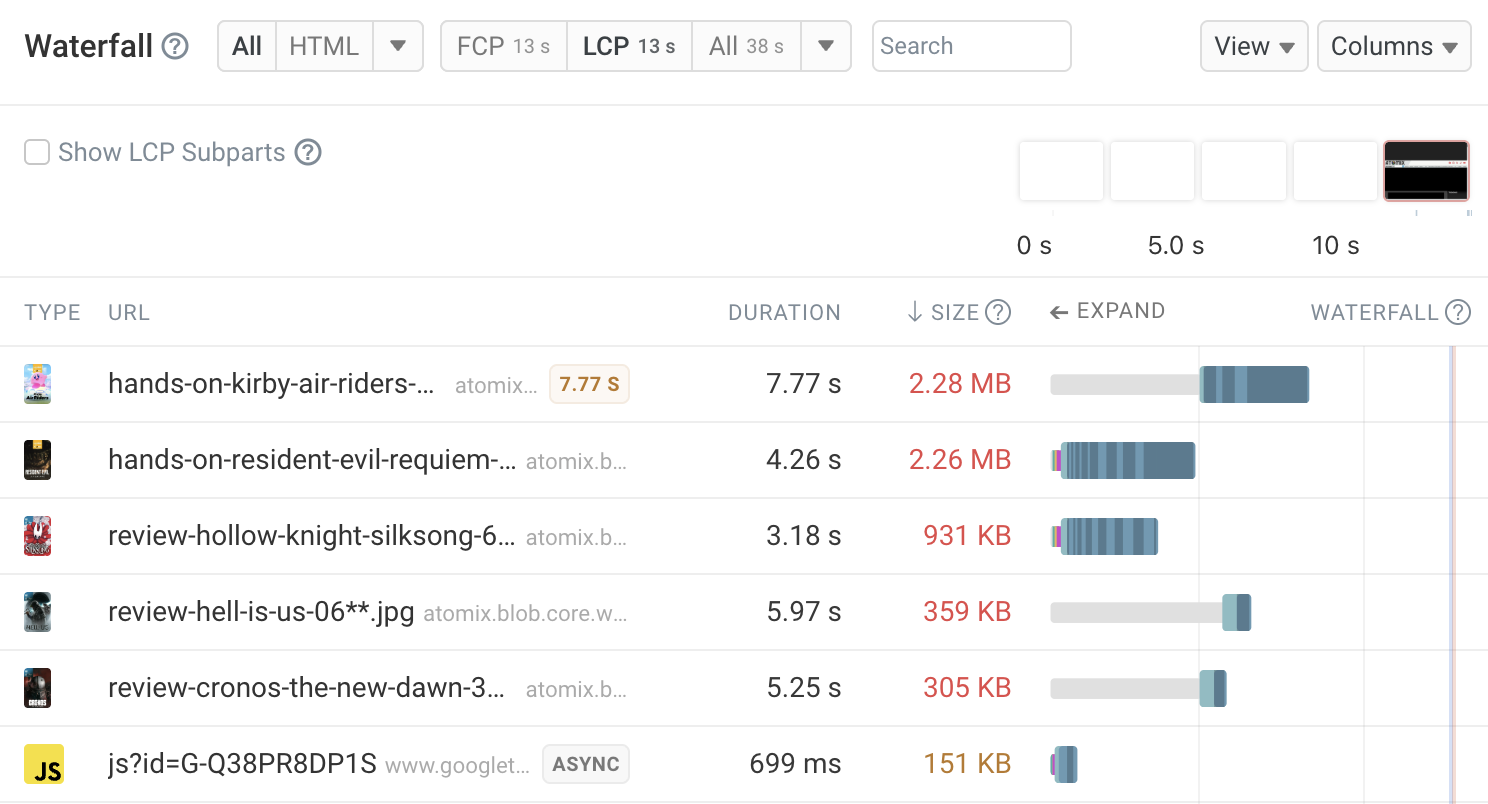
We can see that there are several very large image files in the mix. Investigating the page, the issue is clear:
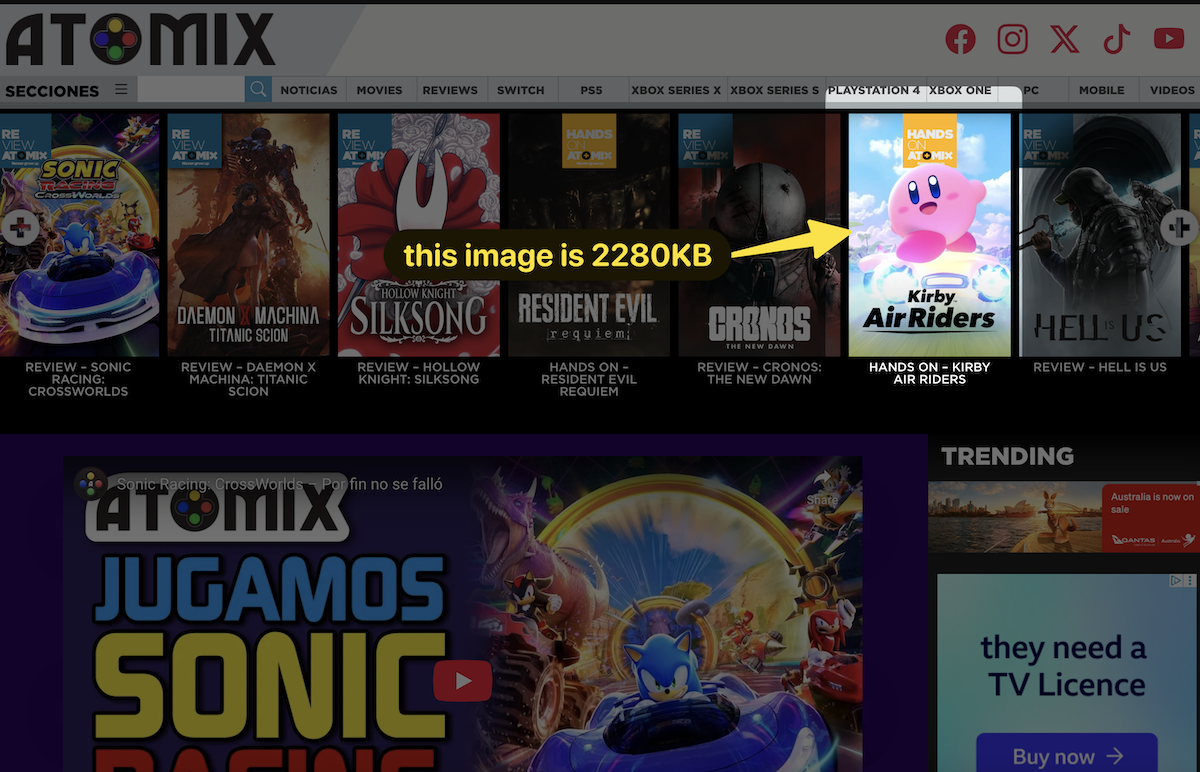
In the review carousel above-the-fold, the constituent images are overly massive. Dimensions-wise they are 3x larger than necessary (590px wide but displayed at 186px), but they are also JPGs that are totally uncompressed.
In contrast, the thumbnails on Multiplayer are all optimized - the image filesize is 97% smaller!

Ironically, when we click through to the corresponding article on Atomix, there is a LARGER featured image – the very same graphic displayed in a larger size:

On the article page, the image has been compressed into a modern image format (WebP), and as a result is only 26kb - a whole 99% smaller.
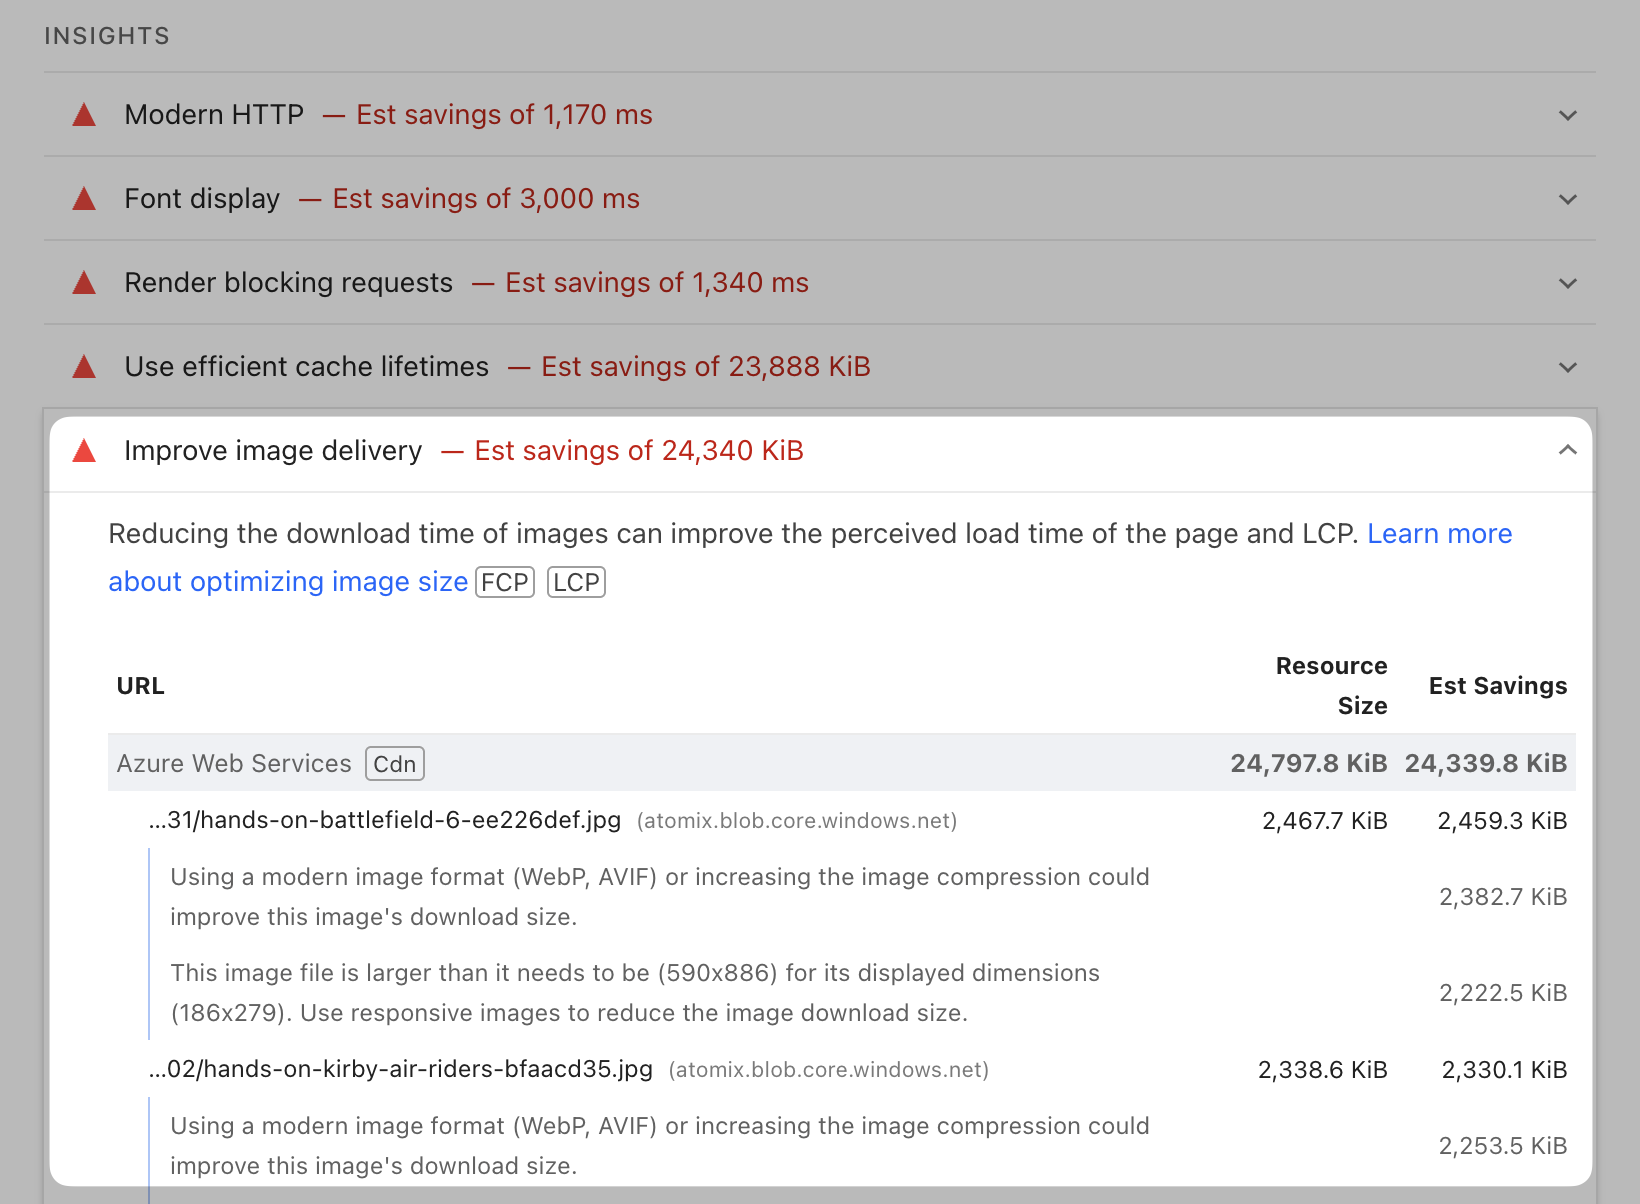
It seems like the site's image compression plugin is being applied to featured images but not to the carousel thumbnails. This leads to the counterintuitive situation where the visually-smaller images have 30x larger file sizes than the visually-larger ones.
The associated Lighthouse insight reveals 33 such images on the homepage, which if all optimized properly would save 24MB from total page weight.
Other fixes we'd consider
Caching and HTTP2: many assets are served from a different server (atomix.blob.core.windows.net). None of these assets have a cache TTL set, and the server doesn't use HTTP2, which means the browser needs to strike up a new server connection for each individual resource request. Not ideal!
Preload LCP background images: On the homepage, the LCP is often a tiled background pattern that appears behind an embedded YouTube video or ad unit. As these are defined in CSS, the browser does not make downloading these a priority.
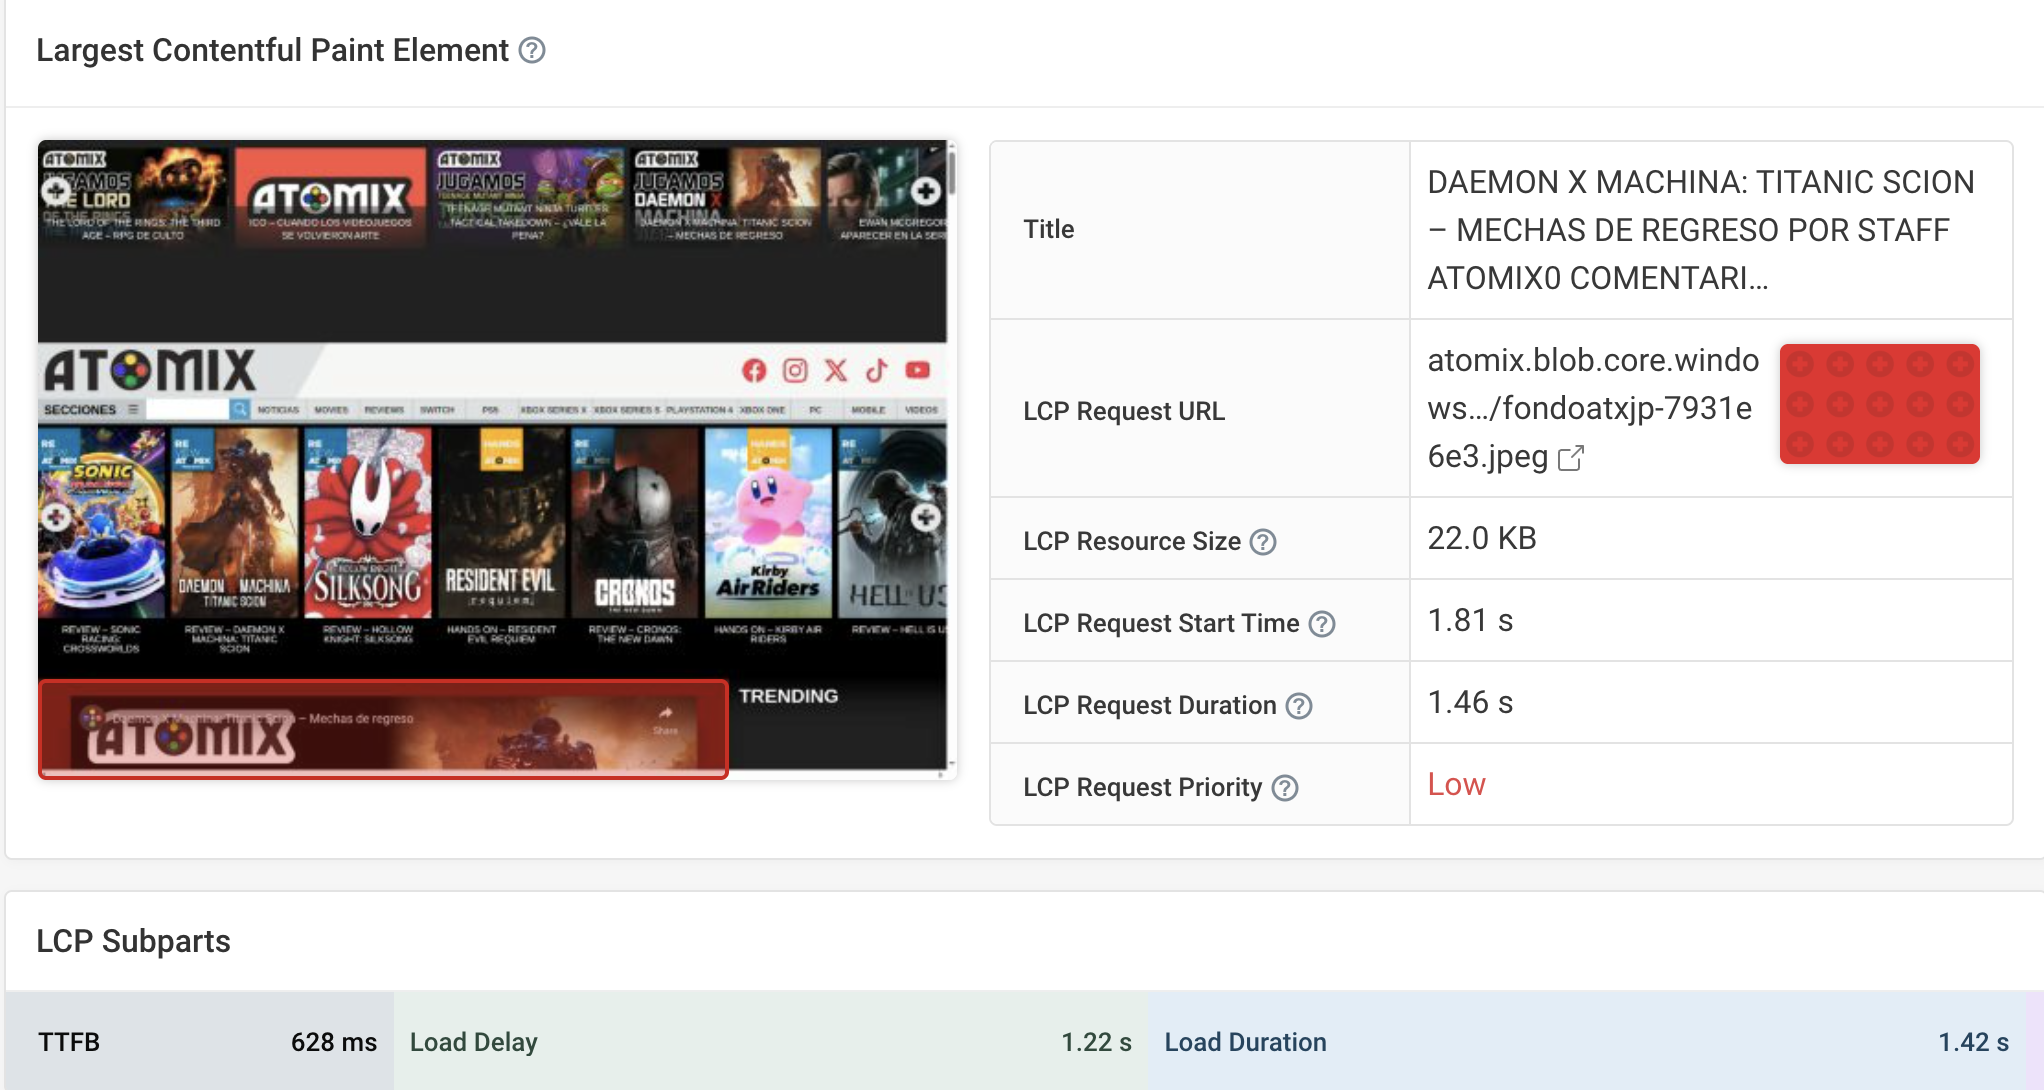
The developers could add a preload hint with fetchpriority to mitigate this issue. (Read more in our guide to fixing LCP for background images!)
Synthetic vs real-user data: what's the story?
Let's also take a moment to explore discrepancies between stats from Google's CrUX data (based on real user experiences) and the equivalent Lighthouse stats from synthetic lab tests. Here's what that looks like for Atomix:
| CruX | Lighthouse | |
|---|---|---|
| Desktop FCP | 1.9 | 1.9 |
| Desktop LCP | 2.17 | 3.3 |
| Desktop CLS | 0.26 | 0.01 |
| Mobile FCP | 1.25 | 3.53 |
| Mobile LCP | 2.2 | 7.37 |
| Mobile CLS | 0.18 | 0.07 |
Two discrepancies stand out:
- Lighthouse lab tests tend to give worse results for page speed (like FCP and LCP) than real users experience
- Lighthouse lab tests tend to give better results for layout shift than real users experience
These are well known phenomena: the former is caused by Lighthouse typically underestimating the network speed of a typical user, while the latter is due to the fact that default lab tests don't scroll or interact with the page as much.
So in the case of Atomix, although many metrics could be much improved, only the CLS is poor 'in the real world', and addressing this issue will make a much more substantive impact. Layout shift aside, site speed is not a showstopping issue for their typical users.
When should you take PageSpeed Insights seriously? Learn to read your data judiciously in our article You Might Not Have A Web Performance Problem.
Three additional benefits that DebugBear enables:
- With our lab tests, you can add a snippet that scrolls down the page to reveal any layout shift issues
- Our packet-level throttling can provide more realistic results than PageSpeed Insights
- Our real user monitoring tools give you an additional perspective, tracking Core Web Vitals metrics for your actual user base and revealing performance issues on a pageview-by-pageview basis
Improving site performance with DebugBear
When it comes to mass-readership sites, a smooth user experience is a vital part of reducing bounce rate and growing time-on-site. This in turn reduces 'pogoing' back to Google, and enhances Core Web Vitals results – both making an important contribution to technical SEO.
At the same time, publishers need to contend with all kinds of plugins, third party scripts and ad units as part of their monetization strategy, but it can't come at the cost of performance.
That's why publishers like The Independent use DebugBear to optimize page speed and defend Core Web Vitals in this complex environment – read the full case study here.
Using a frontend performance monitoring tool like DebugBear can help you detect your key issues, run website tests under various conditions, and make slow-loading websites faster.
To get started, take a look at our interactive demo, run a free website speed test, or sign up for our 14-day no-credit-card free trial which will give you tons of useful ideas on how to speed up your site – fast.


Monitor Page Speed & Core Web Vitals
DebugBear monitoring includes:
- In-depth Page Speed Reports
- Automated Recommendations
- Real User Analytics Data
Want a personal walkthrough for your publishing company? Our founder Matt will take you through how DebugBear could work for your team – book a call here!