Page Speed And SEO In 2025
Page speed doesn't just matter for user experience, but also for search engine optimization (SEO).
In this article we'll take a look at what page speed is, how it's measured, and how it can impact your Google rankings.
What is page speed?
Page speed measures how quickly pages on your website load when a visitor opens them. The faster your website loads and can see content the better!
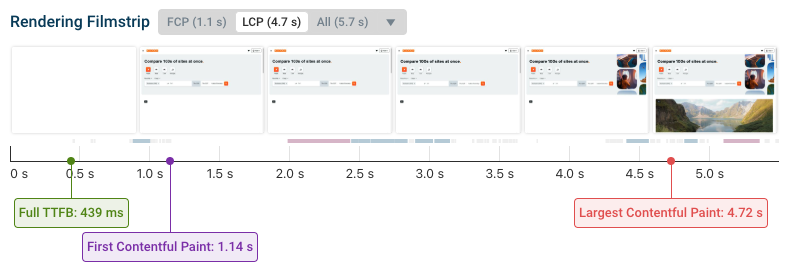
You'll often see rendering filmstrip like this when investigating the performance of a website. It shows the page load process as the website starts rendering. On a fast connection to a speedy website, this might all take less than a second, so it's useful to see it step by step.
How is page speed measured?
To measure page speed we generally look at how soon after navigating to a website the page has loaded. But page load time is a fuzzy concept: there's no single point in time where a website is done loading.
That's why the filmstrip in the previous section is annotated with several annotations marking different rendering milestones.
Let's take a look at what these metrics mean!
Time to First Byte (TTFB)
Time to First Byte is a technical metric that tells you how quickly the website server responded to the request sent by the browser.
That doesn't mean anything visible has changed. TTFB is a purely technical metric, making an important stage in the page load process. But it doesn't tell you what the visitor can see at that point – often they can see nothing at all.
First Contentful Paint (FCP)
The First Contentful Paint measures how quickly the visitor can start to see some page content, for example text or an image.
This is an important page speed metric, because it tells you something about the visitor experience. At the very least they now know that the page is starting to load, and they can also start exploring your page content.
Largest Contentful Paint (LCP)
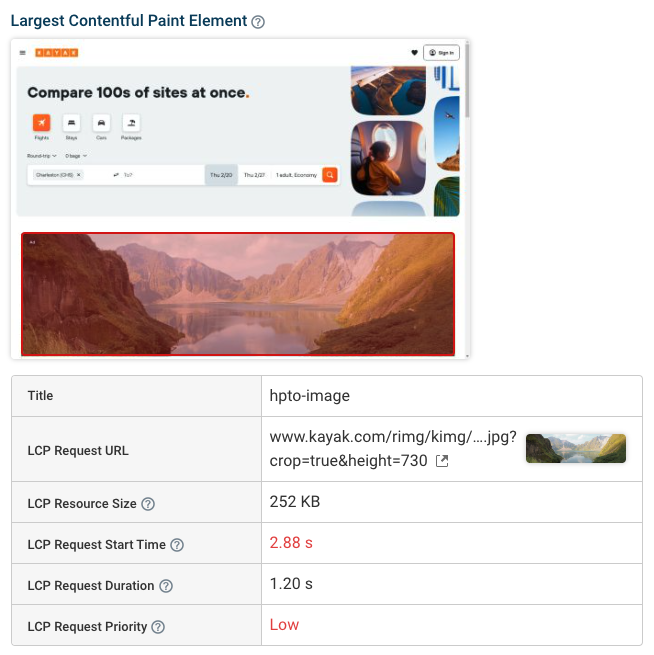
The Largest Contentful Paint is usually the most important page load milestone. Now the user can't just see any content – they can see the biggest content element, like an hero image or the a large heading. Some small parts of the page might still change later on (like a chat widget appearing), but the page content is basically ready when the LCP happens.
To analyze and optimize the Largest Contentful Paint, it's important to look at the largest content element on the page. Is it text or an image? If it's an image, how large is the image? Diving into questions like these helps you understand why the page takes as long to load as it does and sets you up to start rolling out improvements.
More ways to measure page speed
You'll sometimes see other metrics used to measure page speed, for example Speed Index or Time to Interactive. You can check out our detailed guide to website performance metrics, but the three metrics we mentioned above are the most important ones to measure the initial page load time.
Why is page speed important for SEO?
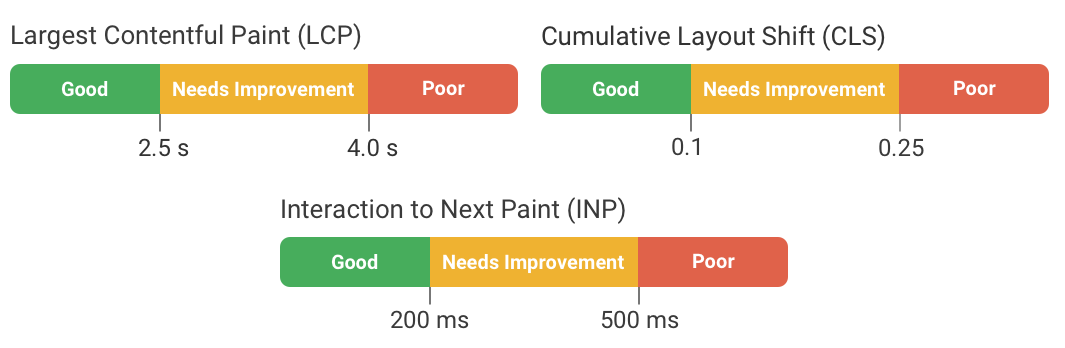
Search engines look at your page speed to decide how you should rank in their search results. For example, Google uses a set of metrics called the Core Web Vitals as a ranking signal. The Largest Contentful Paint metrics we've looked at already is one of these Core Web Vitals metrics.
The other two Core Web Vitals are Cumulative Layout Shift (CLS) and Interaction to Next Paint (INP). CLS looks at whether page content moves around after it appears, and INP measures how quickly your website responds to user interactions.
What page speed do I need for good SEO?
To get a good score your website needs to load within 2.5 seconds, as measured by the Largest Contentful Paint metric. Google considers it a good user experience if your website's main content appears within that time frame.
You'll get a "Poor" rating from Google if your website takes more than 4 seconds to load.
To pass the full Google Core Web Vitals assessment you also need to perform well on the other two web vitals, Interaction to Next Paint and Cumulative Layout shift.
How important is page speed for SEO?
The Core Web Vitals are a key component of Google's technical SEO assessment of your website. But your technical implementation is not the most important factor for Google decide where you should show up in rankings. Content quality is more important.
Google's search relations team lead, John Mueller, has said this about the importance of Core Web Vitals.
Core Web Vitals are not giant factors in ranking, and I doubt you'd see a big drop just because of that. That said, having a website that provides a good experience for users is worthwhile, because if users are so annoyed that they don't want to come back, you're just wasting the first-time visitors to your site, regardless of where they come from.
Examples of page speed enhancements improving SEO
We asked some of the SEO and performance experts who use DebugBear how improving page speed made a difference to their business.
- Casey at Namu Travel told us that "implementing changes based on DebugBear's insights, we saw a significant 15% jump in our SEO performance."
- Steve at performance marketing agency Journey Further explained that fixing Core Web Vitals for one client increased page 1 rankings by 28%
- When Rafayel at CoinStats used DebugBear to give more pages a 'Good' Core Web Vitals score, he increased Google impressions on Google by 300%
How to check the page speed of your website
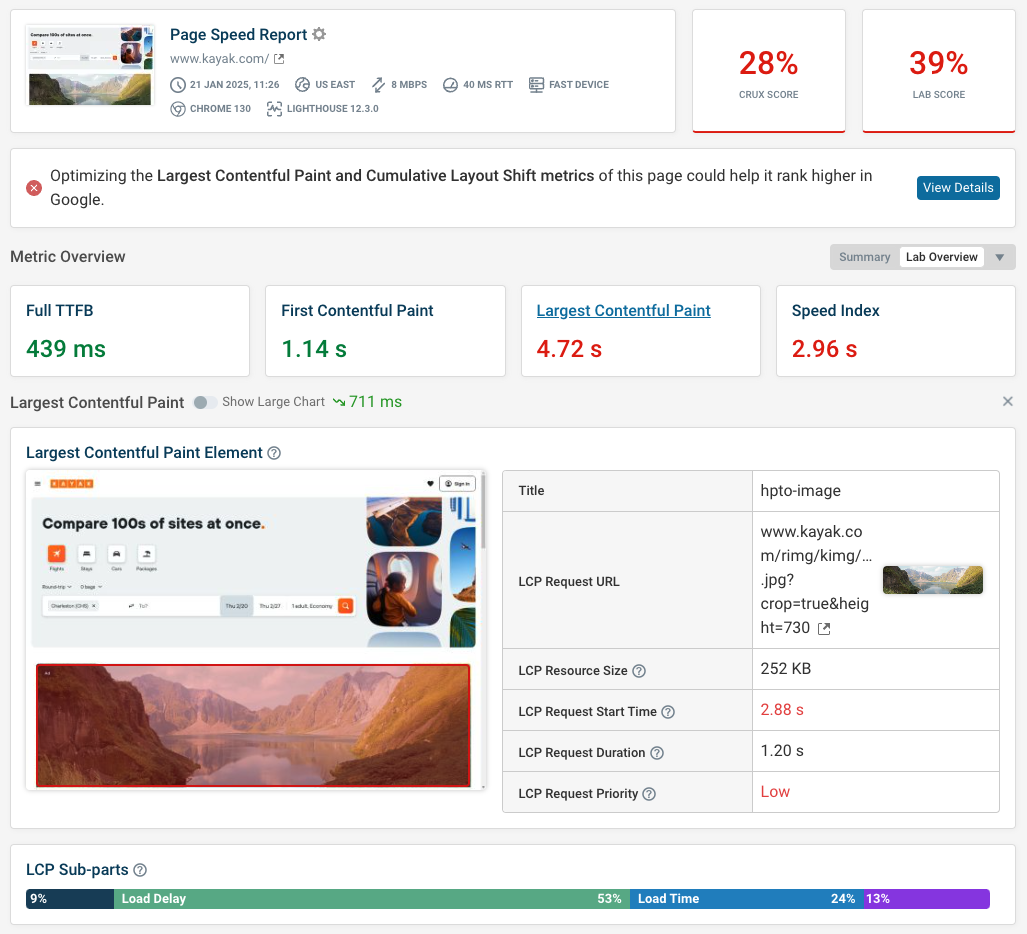
A number of free tools are available to check your page speed online. One good place to start is the free DebugBear speed test.
It will analyze your website, show you how it loads, generate a detailed technical report, and provide custom recommendations for how to speed up your website.
This tool is where the rendering filmstrip and LCP element view from earlier are taken from.
DebugBear provides a lot of data. If you're looking for a simpler overview, try Google's PageSpeed Insights tool instead.
At the top you'll get a quick summary of how fast your website is for real users. Google collects this data from logged-in Chrome users as part of the Chrome User Experience report (CrUX).
Page speed data from the CrUX report is what Google uses as an SEO ranking factor.
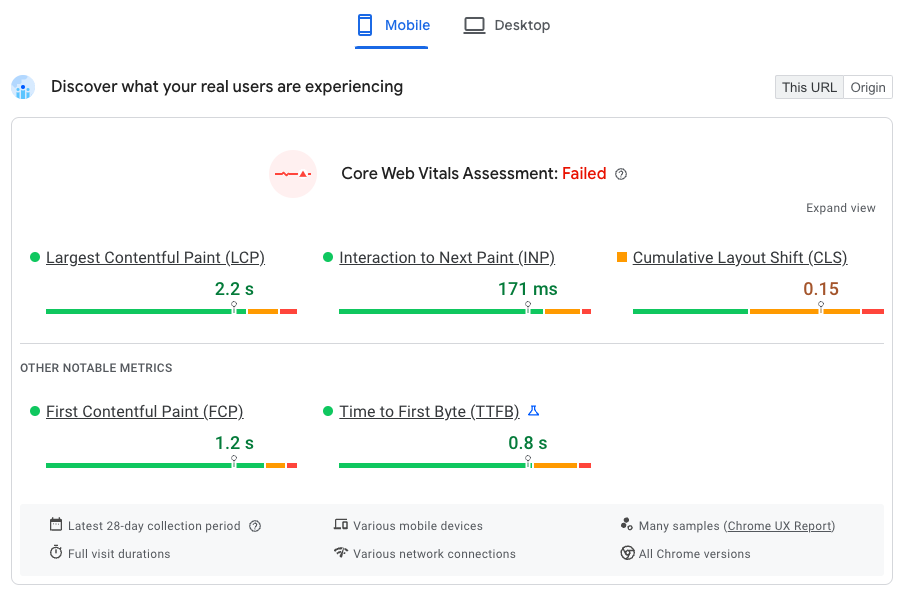
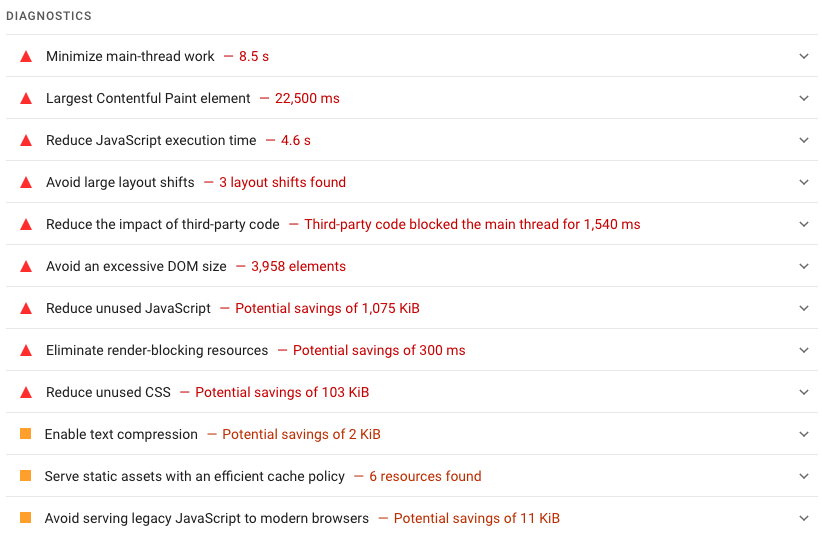
Below the real-user summary, Google also shows more detailed synthetic performance data including recommendations to improve your website speed.
However, keep in mind that this PageSpeed Insights data isn't always reliable.
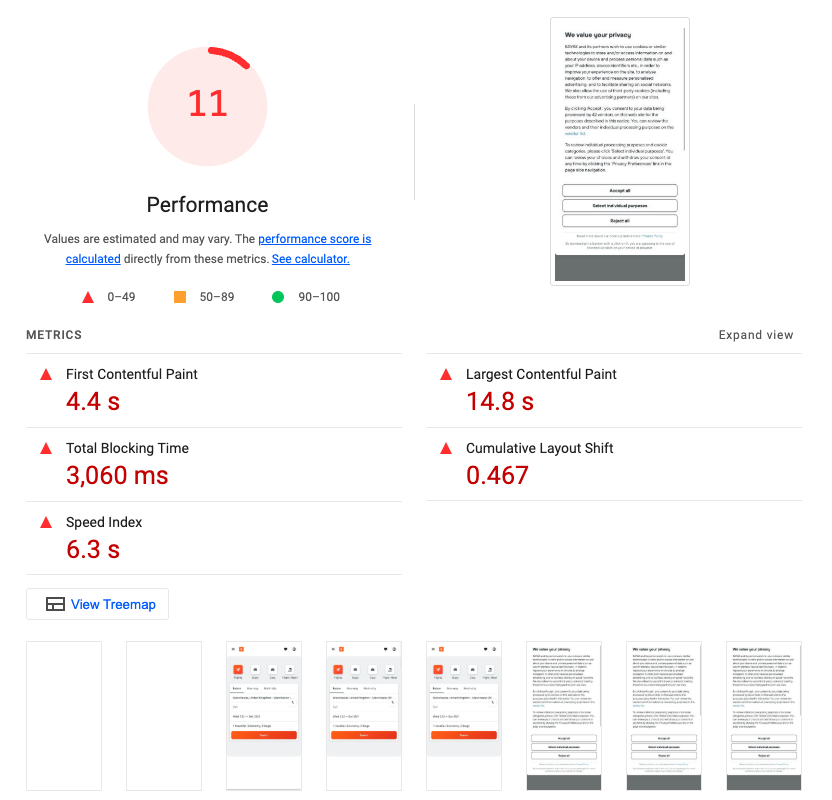
You can also use Google's Lighthouse tool to test your website directly from your computer.
You'll get an overall Performance score as well as more insight on how your page loads.
Many tools, including DebugBear and PageSpeed Insights, are built on top of Lighthouse. But there are significant differences in how they collect data under the hood and the reporting functionality they offer.
How to improve page speed for SEO
Now that you understand how page speed impacts your Google rankings, let's look at the specific steps you can take to make your website faster – especially if your page speed test has revealed poor results!
We've organized these recommendations from easiest to most complex, and separated them into front-end optimizations (changes to the page itself) and back-end improvements (server and technical infrastructure).
Front-end page-speed optimizations
These are the fixes that you can probably address as an SEO specialist by tweaking the content on the page, or the code of your site template.
Resize and compress images, using modern formats
Images are often the biggest culprit when it comes to slow page speeds. A single unoptimized image can be larger than your entire website's code!
Don't upload a 2000px wide image if it's only going to be displayed at 400px on your website. The browser still has to download the full-size image, wasting bandwidth and slowing down your page. Check how large your images actually appear on desktop and mobile devices, then resize them properly. This is especially important for mobile optimization.
To offer fully responsive images, use tags to offer the browser image files in multiple sizes depending on the user's device – it will then download the optimal image, rather than the largest possible one. You should also avoid relying heavily on large data URLs to serve images.
You can also compress your images before uploading them. – tools like TinyPNG or Squoosh can reduce file sizes by 50-80% without visible quality loss. WordPress users can install plugins like Smush or ShortPixel to automatically compress images as they're uploaded. You can also consider using modern image formats like WEBP and AVIF that can result in smaller file sizes.
Implement lazy loading for images and videos
Lazy loading means images and videos only start downloading when they're about to come into view. This can dramatically improve your initial page load time, especially on long pages with lots of media.
Modern browsers support lazy loading natively – just add loading="lazy" to your image tags.
Remove unused CSS and JavaScript
Between your own site code, third-party plugins, template files and other scripts, pages can become unnecessarily bloated. A few tips to improve page speed are:
- Remove unused code: turn off plug-ins that are no longer in use, and remove Javascript and unused CSS that isn't relevant to how your site operates.
- Defer code that isn't immediately necessary: use async or defer attributes to postpone non-urgent scripts
- Prioritise critical code: use preloading resource hints and fetchpriority attributes to ensure the resources needed 'above the fold' arrive as quickly as possible
Tools like PurgeCSS can identify unused CSS, while Chrome DevTools' Coverage tab shows which JavaScript is actually being used. Many performance plugins can automatically remove unused code, though this requires careful testing to ensure everything still works as expected.
Analysing your page with DebugBear's waterfall request view can help you idenitfy your most sluggish scripts. Culprits might include tracking and analytics pixels, ad scripts, chat integrations, and cookie and privacy banners.
Minify CSS and JavaScript files
Minification removes unnecessary spaces, comments, and formatting from your code files, making them smaller and faster to download. Many WordPress caching plugins like W3 Total Cache or WP Rocket include minification features. If you're using a different CMS or custom website, build tools like webpack or online tools like CSS Minifier can handle this automatically.
Page speed optimizations on the back-end
Aside from the HTML file and resources on the individual page, the rest of your technology stack, like your hosting provider, servers, CMS and database, can also have a major impact on page loading times. This is often reflected in a slow 'time to first byte' metric, or long loading delays for individual resources.
Enable browser caching
Browser caching tells visitors' browsers to store certain files locally, so they don't need to re-download them on future visits. This dramatically improves repeat visit performance. Most web hosts allow you to set caching headers through your hosting control panel. WordPress users can use caching plugins, while other platforms might require adding caching rules to your .htaccess file or server configuration.
Implement server-side caching
Server-side caching stores pre-generated versions of your pages, eliminating the need to rebuild them from scratch for each visitor. This can improve page load times substantially, because you don't need to keep querying your database.
Enable server-side compression
Server-side compression (Gzip or the newer Brotli) can reduce the size of your HTML, CSS, and JavaScript files by 60-80% before they're sent to visitors' browsers.
Most modern web hosts enable Gzip compression by default, but you should verify this is working. You can usually enable it through your hosting control panel or by adding rules to your .htaccess file. Brotli compression is even more effective than Gzip but requires more recent server software. Check if your host supports it – the file size savings can be significant.
Upgrade hosting and server resources
Your hosting plan has a fundamental impact on page speed. Shared hosting plans with limited CPU and memory resources can struggle to deliver fast page speeds, especially during traffic spikes. Consider upgrading to VPS, cloud hosting, or managed hosting providers that specialize in performance.
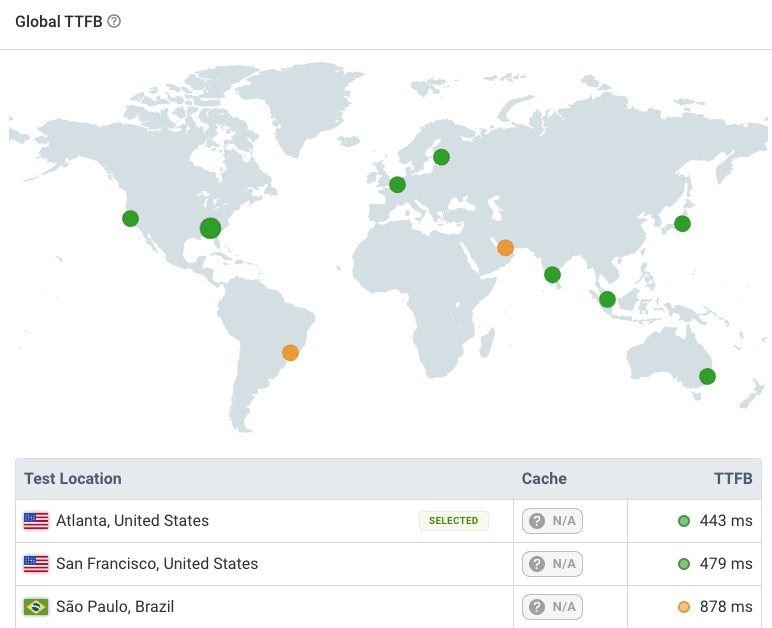
You can also consider using a Content Delivery Network, a service that hosts your content in multiple locations around the world. This means, for example, a user in Amsterdam will only need to connect to a server in Paris rather than Seattle or Singapore, which sharply reduces the network round-trip time for each data request.
You can use our free TTFB testing tool to see how the performance of your website varies across the world.
Use HTTP/2 or HTTP/3
HTTP/2 and the newer HTTP/3 protocols can significantly improve page load times, especially for pages with many resources. These protocols allow multiple files to be downloaded simultaneously and use improved compression.
Most modern hosting providers support HTTP/2, but you should verify this is enabled. HTTP/3 is newer and less widely supported, but can provide additional performance benefits. The switch to these newer protocols is usually handled at the server level rather than requriing changes to your website code.
How to monitor page speed
If you want to get the SEO benefits from having good page speed, you need to make sure that your website is fast consistently. That's where a Core Web Vitals monitoring tool like DebugBear comes in.
DebugBear combines three types of page speed data to give you a comprehensive view of your website performance:
- Scheduled lab-based tests with in-depth reports
- Google CrUX data tracking for SEO
- Real user monitoring across your entire website
See how your pages are doing at a glance, before diving in to find optimizations or identify the cause of a page speed regression.
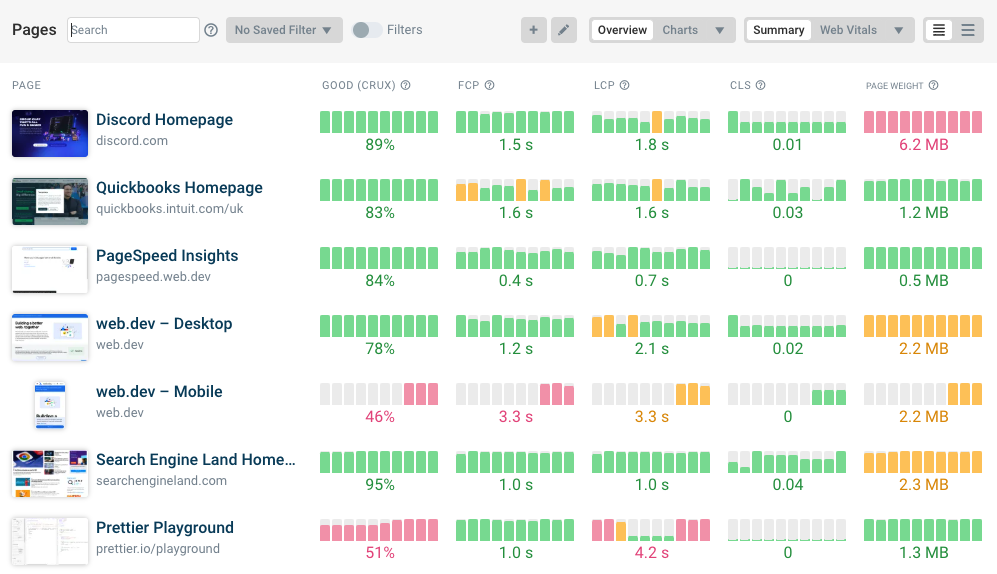
You can monitor both your own site and those of your competitors.
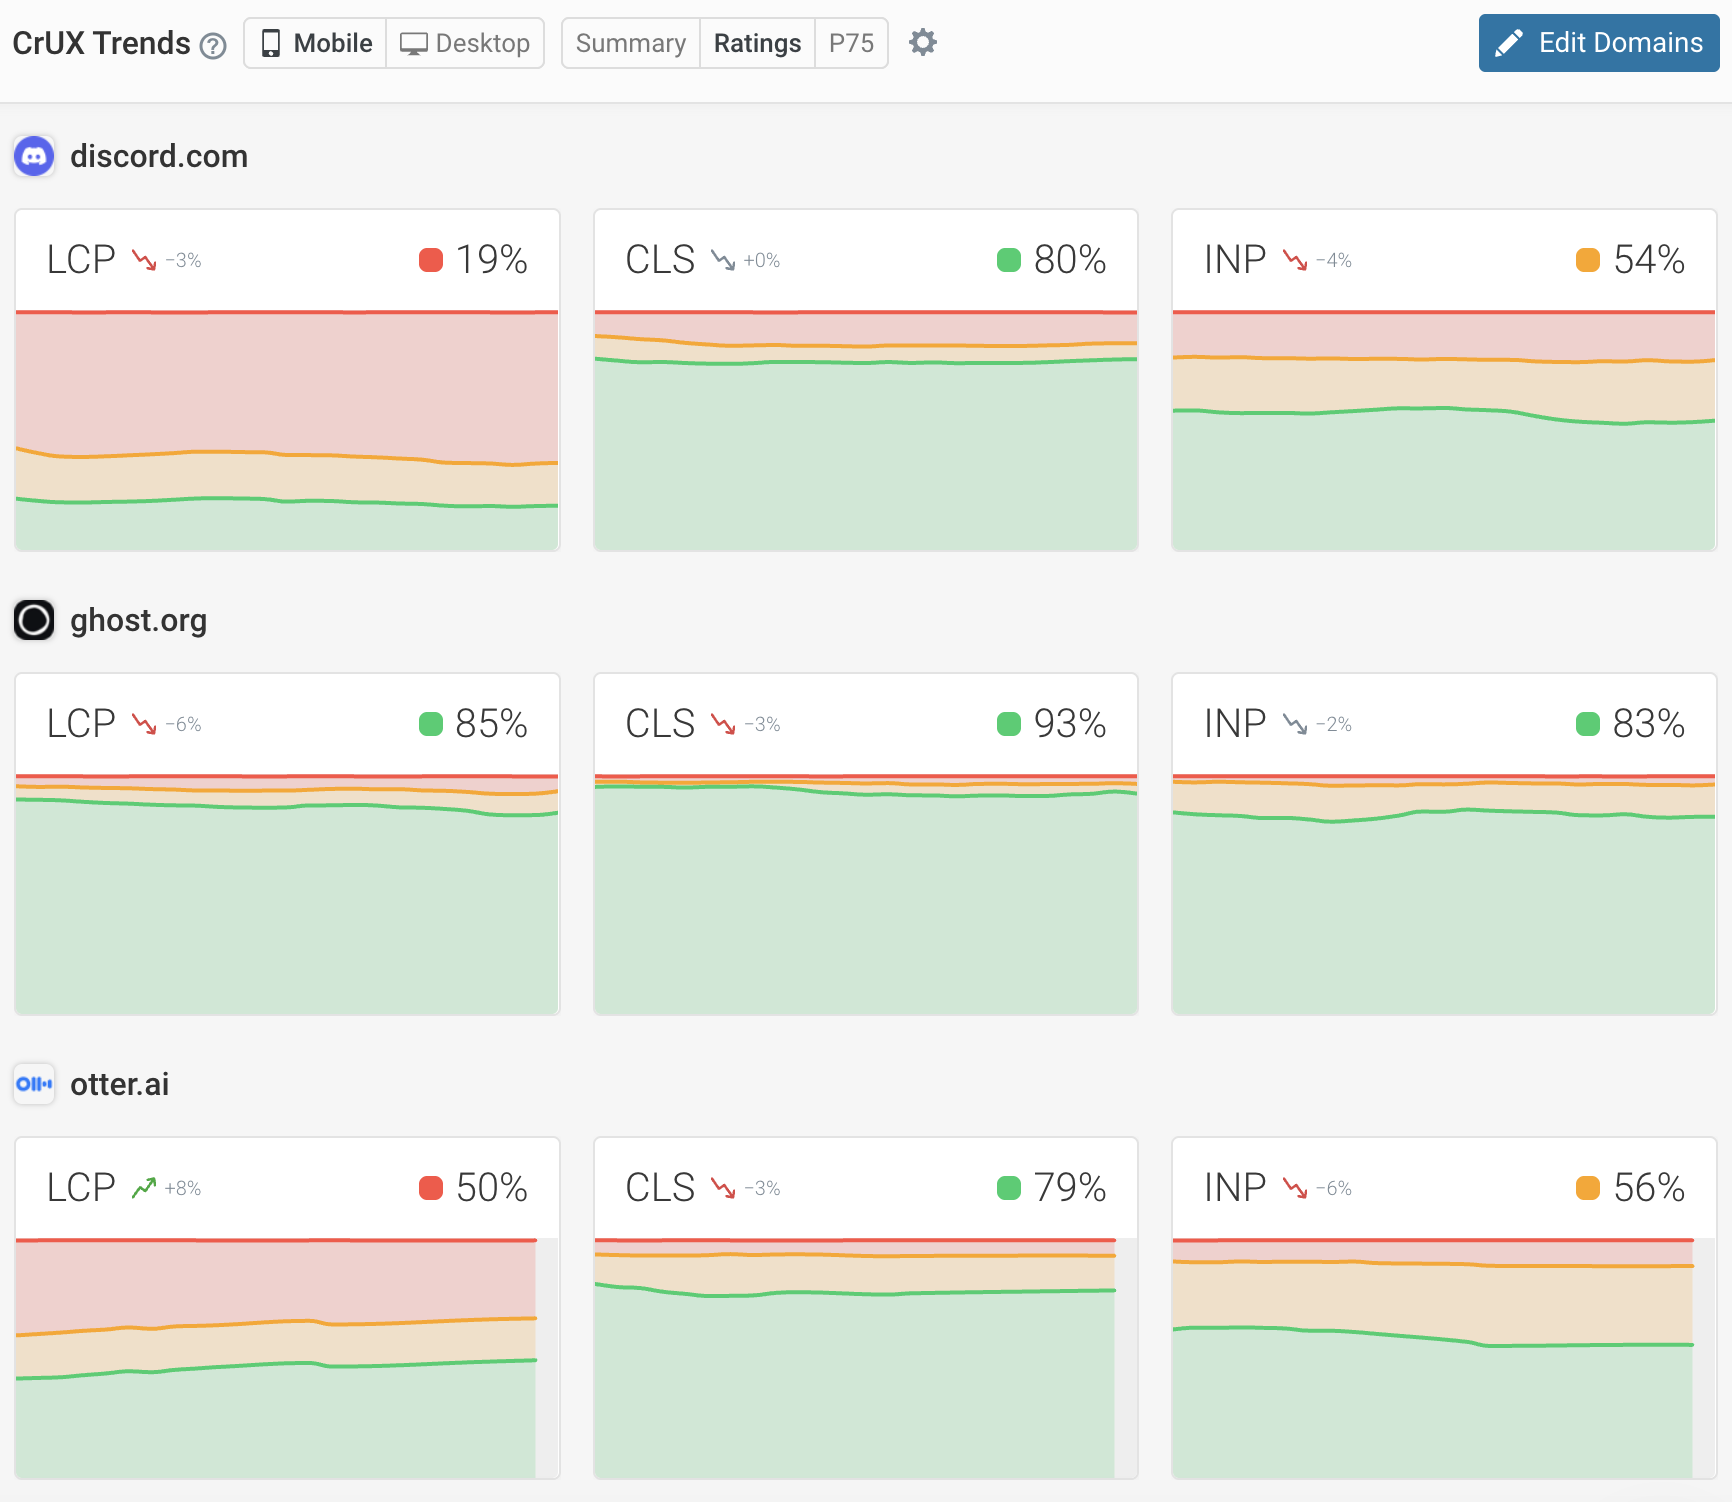
The CrUX data dashboard is a great way to benchmark your website within your industry and see whether you're improving or getting worse.


Monitor Page Speed & Core Web Vitals
DebugBear monitoring includes:
- In-depth Page Speed Reports
- Automated Recommendations
- Real User Analytics Data