
Browser developer tools are essential for debugging problems with your website. And if you're facing Safari-specific issues, whether on your Mac or on iOS, you'll need to use the Safari developer tools.
This article provides a detailed guide to how to get started with the Safari Web Inspector and introduces some of its more advanced features.
What are the Safari DevTools and the Safari Web Inspector?
Safari's developer tools provide functionality to help developers identify and fix problems on their website. That can mean functional bugs, styling issues, or slow page load times.
The primary feature of Safari's DevTools is the Web Inspector. It allows developers to inspect content, network requests, and more on the currently opened page.
How to enable Safari Developer Tools
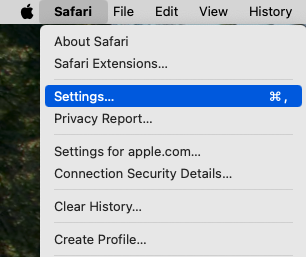
Before using the Safari Web Inspector you first need to enable developer features in the Safari browser configuration.
First, open the Safari menu and select Settings.
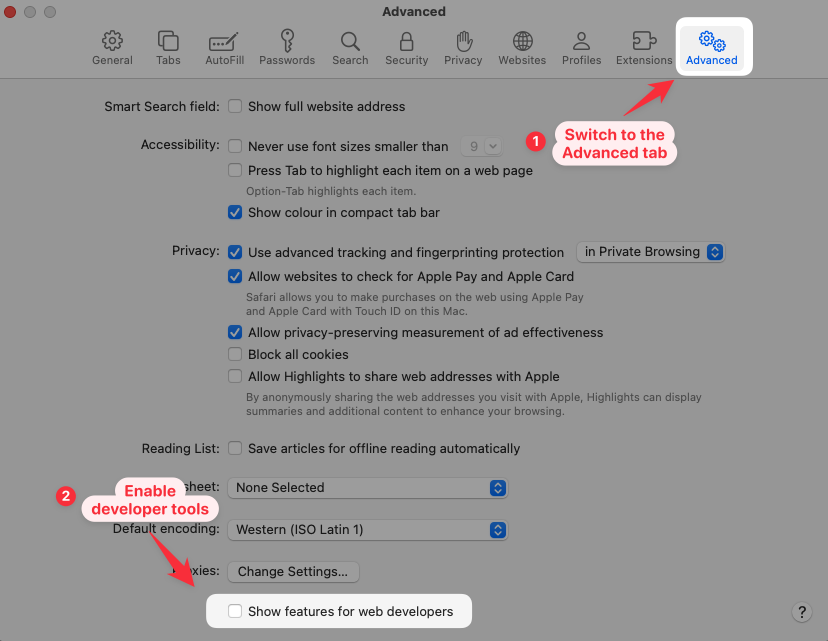
In the settings menu you need to:
- Switch to the Advanced tab
- Check the Show features for web developers box
How to open Safari's developer tools
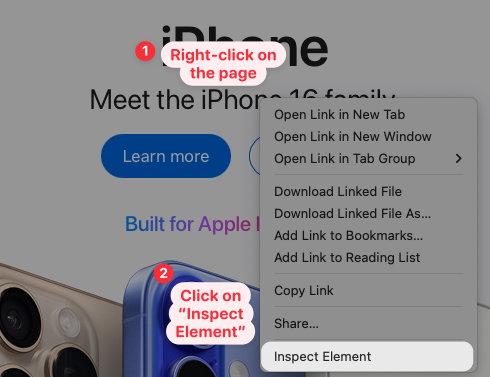
Once the developer tools are enabled, a quick way to open them is to:
- Right-click on the page
- Select Inspect element
What is the keyboard shortcut for Safari developer tools?
You can also use the Option + Command + I keyboard shortcut to open the Safari Web Inspector for the current page.
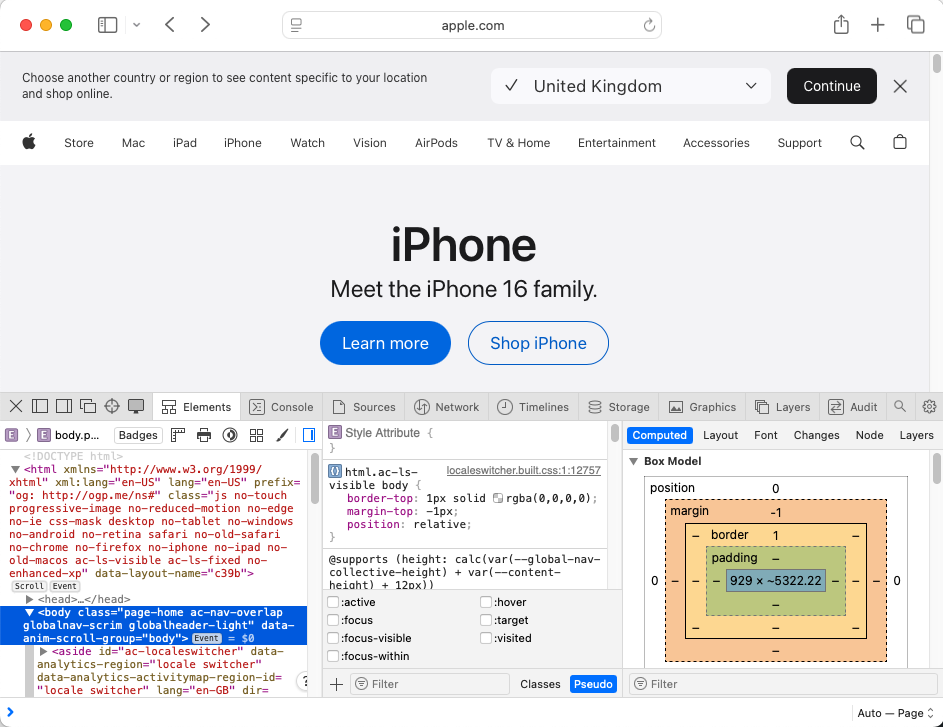
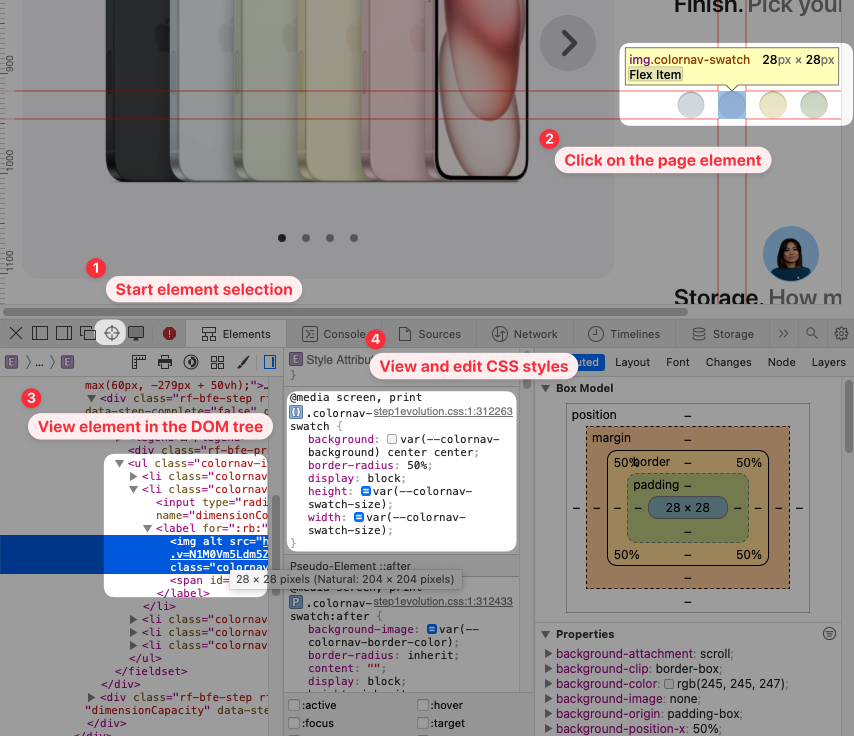
Inspect page contents with the Elements tab
The Elements tab of the Safari Web Inspector allows you to view detailed information on nodes in the website DOM Tree (Document Object Model).
You can right-click elements on the page and select Inspect Element or click on the Start element selection button in the Safari developer tools.
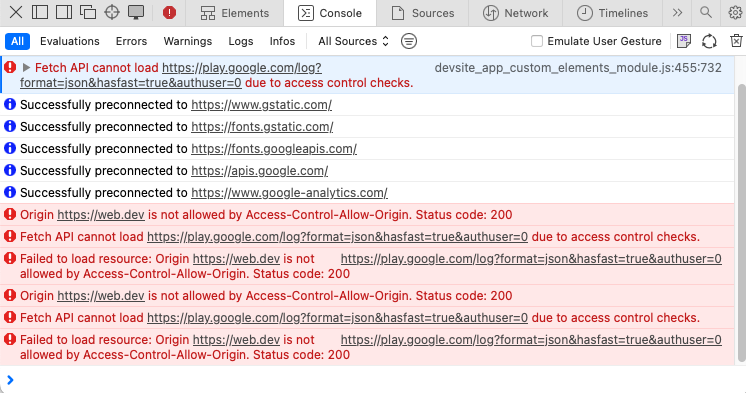
View errors and logs with the Safari console
The Safari browser console surfaces log output from the page and allows developers to run JavaScript code.
For example, the Safari console tab shows:
- Failed network requests
- JavaScript errors and warnings
- Preconnect resource hints
- General debug logs
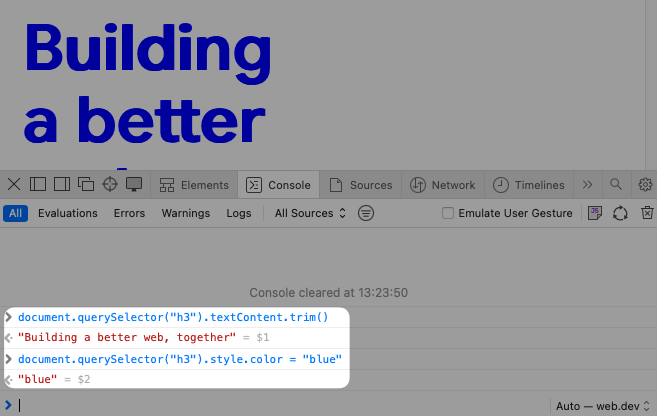
You can also enter JavaScript code to run on the page.
For example, here we're finding a page element by selector, logging its text content, and updating the text color.
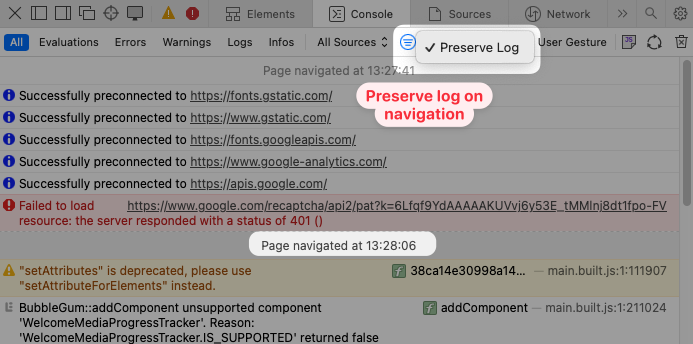
How to preserve logs on navigation
By default, logs in the Safari console tab are cleared every time you open a new page. That can make it difficult to debug page activity that happens when clicking on a link for example.
To preserve logs on navigation click the icon to the right of "All Sources" and check Preserve Log.
Record network requests
The Safari Network tab shows you what resources are loaded by the page you're on. For example, when loading a website the browser will load the HTML document, CSS stylesheets, JavaScript code, images, web fonts, and more.
For each request you can see the request URL, resource type, transfer size, and request duration.
On the right Safari also shows a request waterfall. This visualization shows you how long each resource takes to load and what most of that time is spent on.1
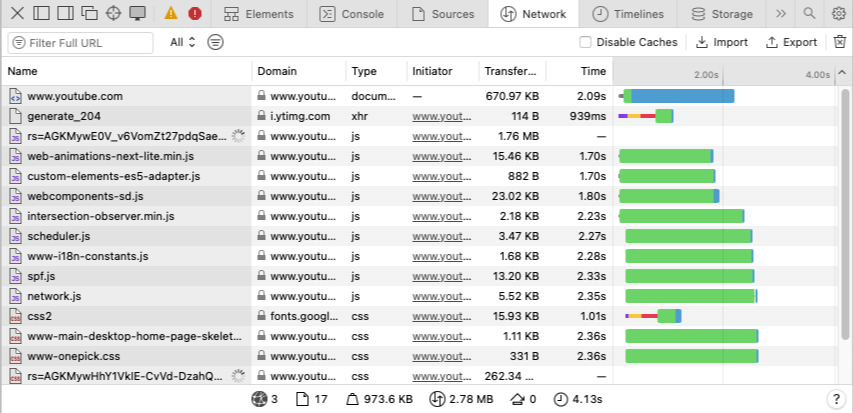
If the transfer size shows up as (memory) or (disk) that indicates that the resource was loaded from the browser cache.
You can click on each request to view additional details, for example the response body or HTTP headers.
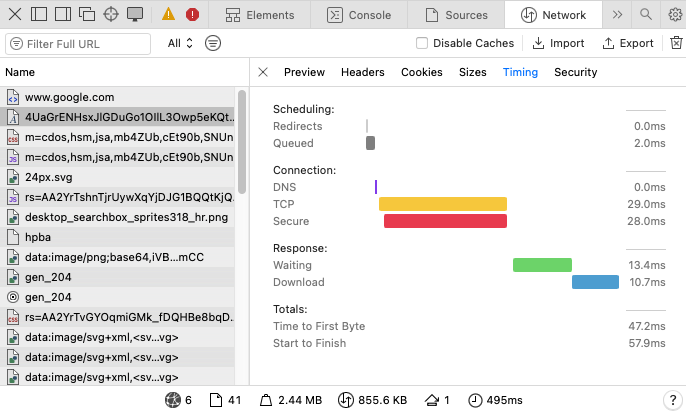
The Timing tab shows a breakdown of the overall request duration:
- A request may be queued because it is low-priority
- The DNS lookup converts the website domain to a server IP address
- The TCP and Secure SSL steps are required to create a secure and reliable server connection
- Waiting time measures how long it takes for the browser to receive the first chunk of the server response (Time to First Byte)
- Download time shows how long it takes to load the full response, which depends on the available network bandwidth
Throttling the network in Safari
The Safari Web Inspector used to have an "Allow throttling" experiment, but unfortunately this is no longer available.
However, you can use the Apples's free Network Link Conditioner. Install Xcode and then look go to the Apple Developer More Downloads page and find the "Additional Tools for Xcode" download for your Xcode version.
Once that's installed you can enable network throttling in your Mac settings. You can choose from different pre-defined speeds like 3G or DSL, or create your own custom network profile.
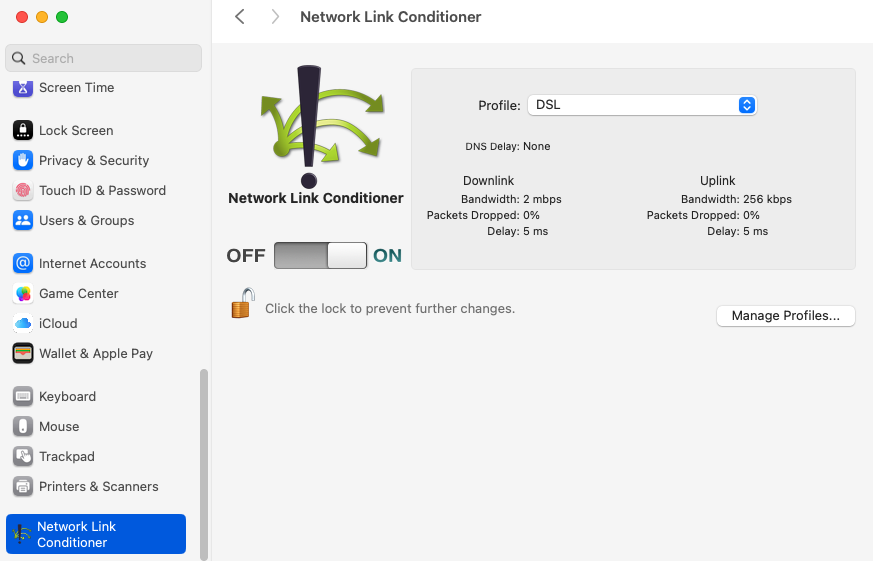
Unlike network throttling in Chrome DevTools, the Network Link Conditioner throttles the network for all applications on your computer, not just for one browser tab.
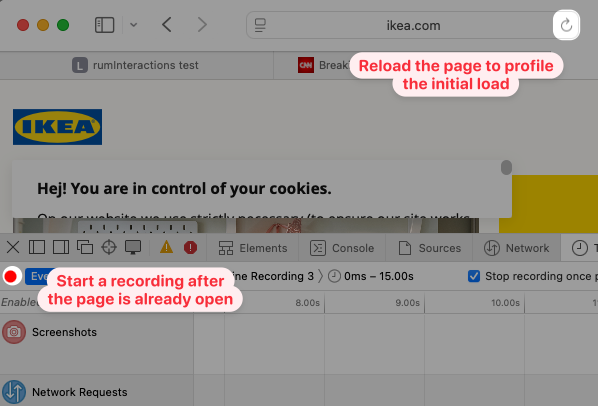
Timelines: profile performance in Safari
The Timelines tab in the Safari Web Inspector shows what different types of page activity happen as your website is loading, or during interactions later on.
For example, you can see:
- Frame-by-frame rendering progress
- Network requests
- CPU tasks
- Page memory consumption
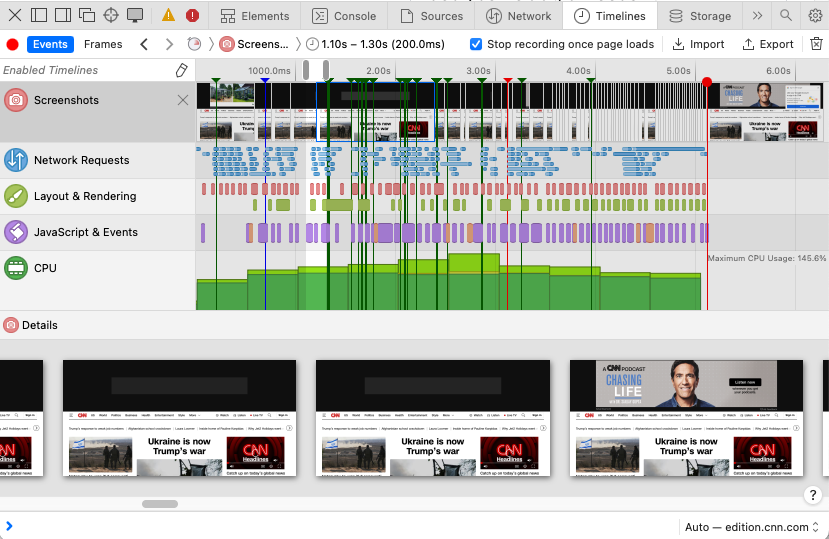
To get started, click on the red recording icon or reload the page to record the initial page load.
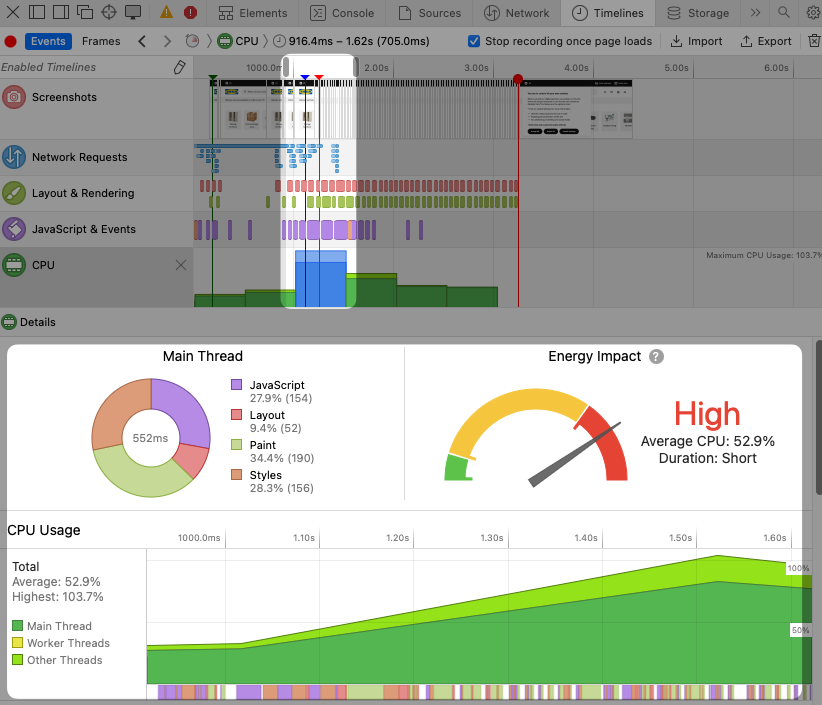
You can zoom in different parts of the timeline to view a breakdown of CPU activity:
- The Layout & Rendering lane shows styling and layout tasks in red and compositing and painting tasks in green
- The JavaScript & Events lane shows script evaluation
The details view at the bottom shows an overall breakdown of main thread work by type and an indication of the energy impact of CPU activity on the page.
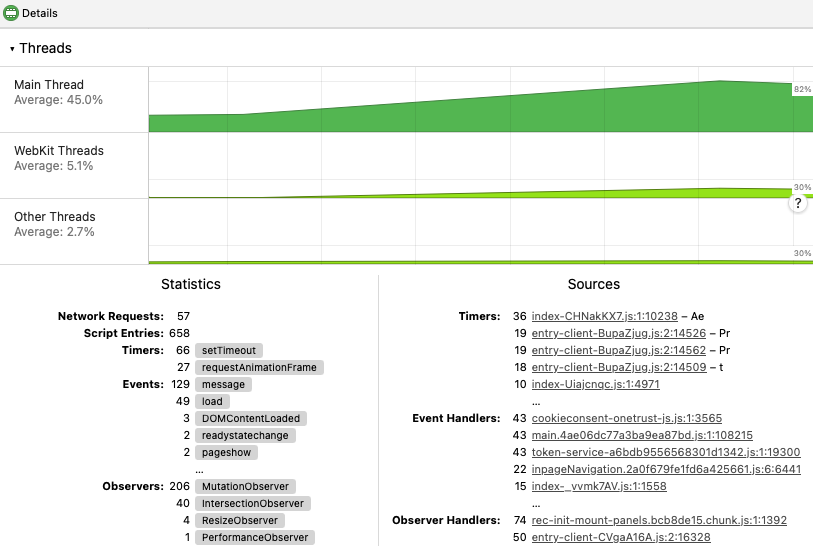
If you scroll down a bit further you get a more in-depth breakdown of CPU processing on the page. For example, you can see when different threads on the page were busy.
Safari also shows why different tasks ran on the page, for example due to setTimeout calls, in response to a load event, or because a mutation observer fired on the page.
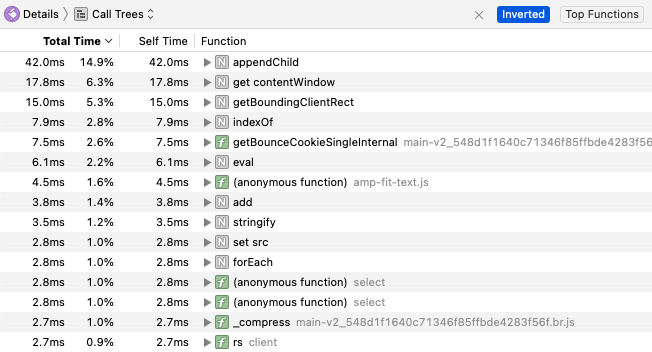
JavaScript profiling
Safari does not offer the fancy Performance profiler that comes with Chrome, but if you select the JavaScript & Events lane and switch from Events to Call Trees you can still see what's slowing down your code.
The Inverted option shows you the functions where the most time is spent.
Memory profiling
Click the pencil icon to edit the available lanes and view more information on memory usage and JavaScript memory allocations on the page.
Memory usage is split into two types:
- JavaScript: memory used for the JavaScript heap
- Page: other memory consumption, for example to store images and other resources
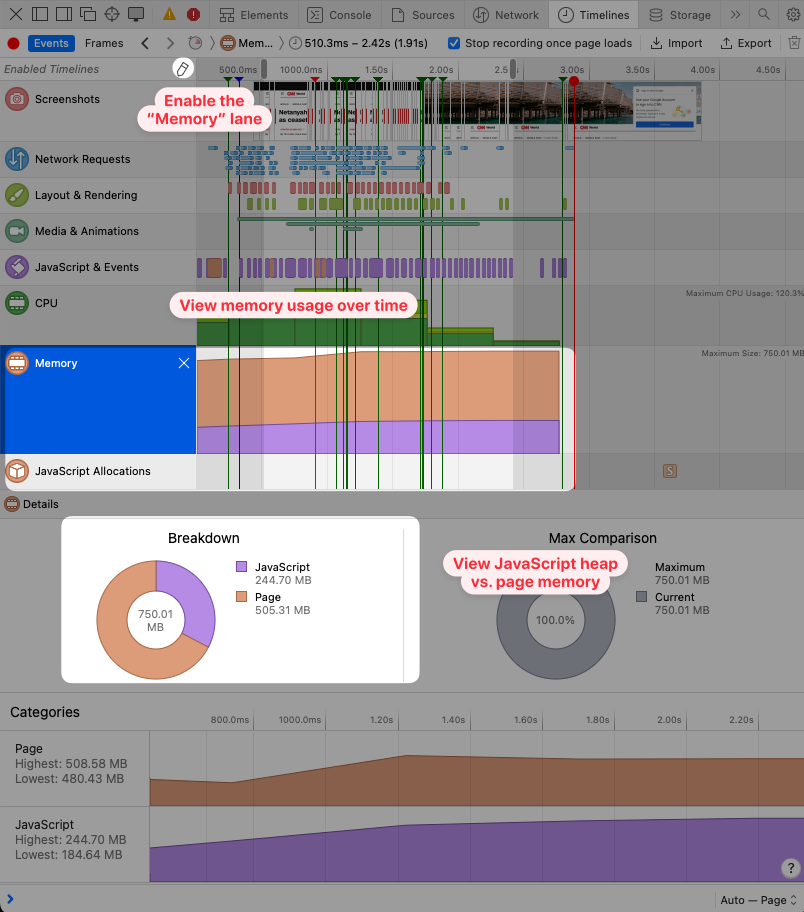
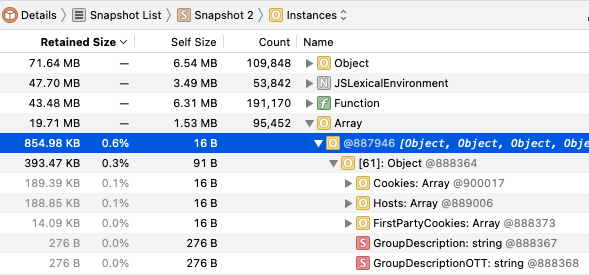
Click on the JavaScript Allocations lane to view what objects are being retained in memory and what is contributing to their size.
View code in the Sources tab
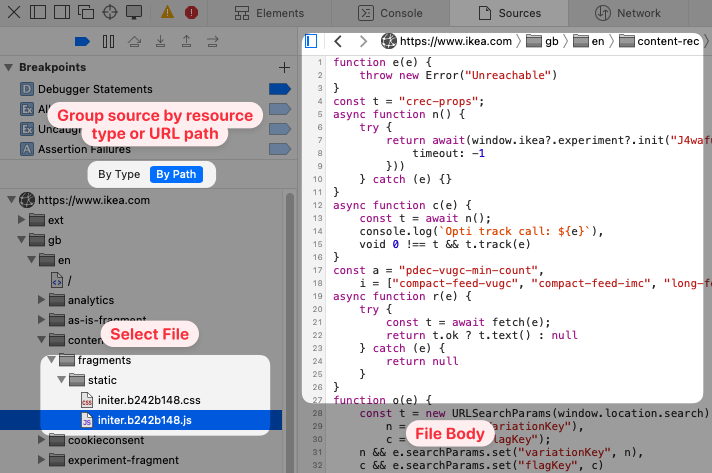
The Safari Sources tab shows you the content of the different resources loaded on the page: not just HTML, CSS, and Javascript, but also images and API responses!
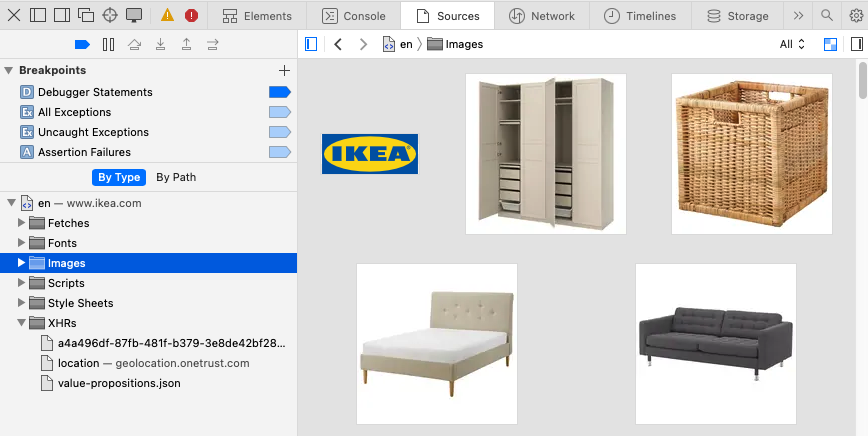
You can group files by resource type or as a directory tree based on the URL.
Click on a file to view its response body on the right.
Debug JavaScript in Safari
The Safari Web Inspector also includes a JavaScript debugger. You can pause JavaScript evaluation, step through functions line by line, and inspect local variable state.
- Open the file containing the code you want to debug
- Click on a line number in the source view to set the breakpoint
- Wait for the code to run (this may require a page reload or interaction)
- The debugger pauses
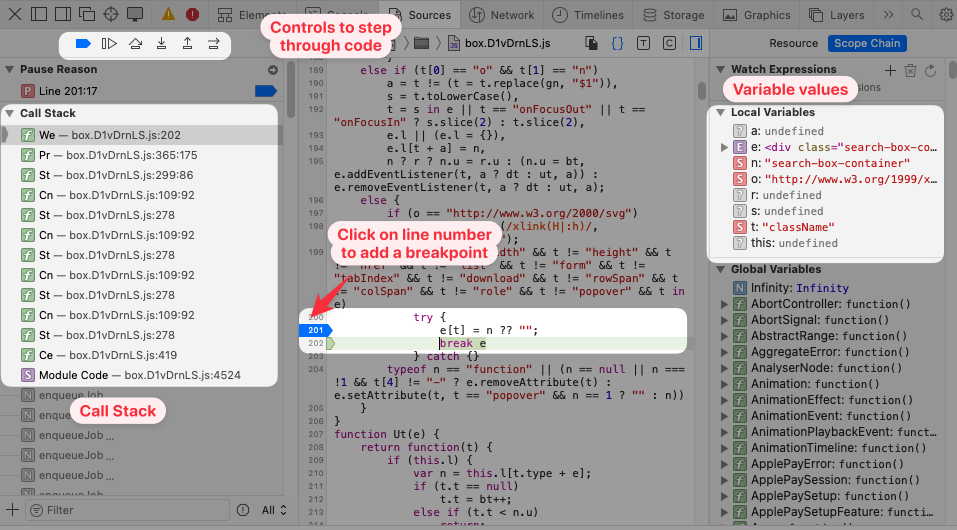
The call stack shows you what functions were called leading up to the current position in the source code. The Step Into and Step Out debugger controls allows you to control the location in the call stack.
The panel on the right shows watch expressions, local variable values, as well as available variables from higher JavaScript scopes.
Emulate a mobile view with responsive design mode
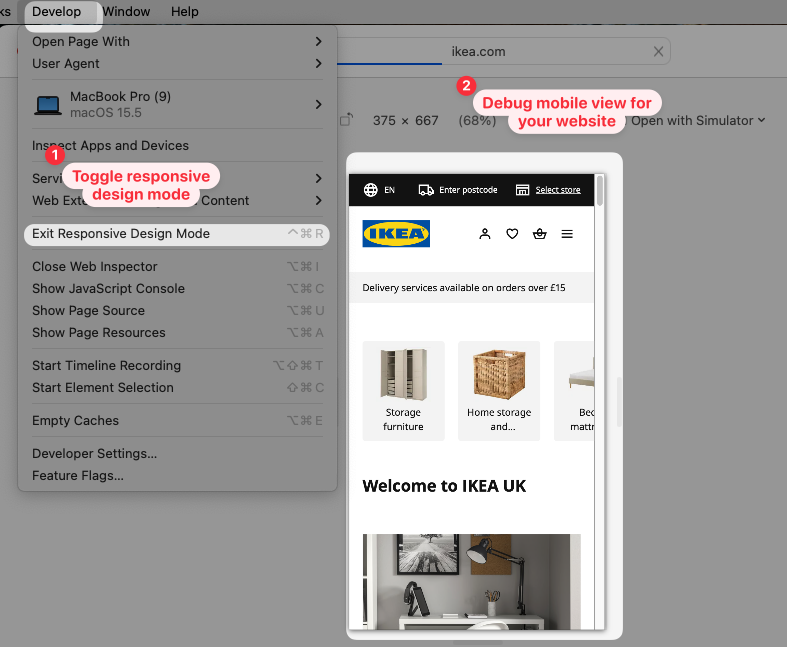
If you want to test your website on a mobile device you can use the Responsive Design Mode in Safari.
- Open the Develop menu
- Click Enter Responsive Design Mode
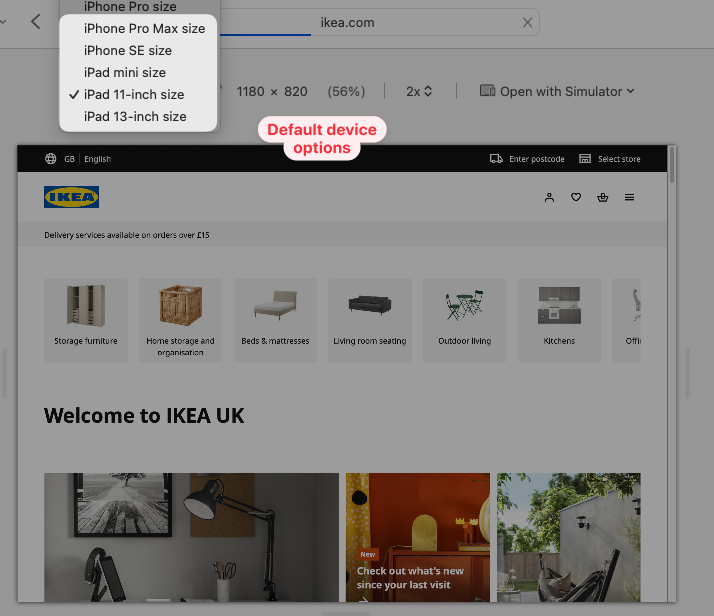
You can either select a custom device size and screen resolution for the Safari mobile emulator or pick from one of the available defaults:
- iPhone Pro
- iPhone Pro Max
- iPhone SE
- iPad mini
- iPad 11-inch
- iPad 13-inch
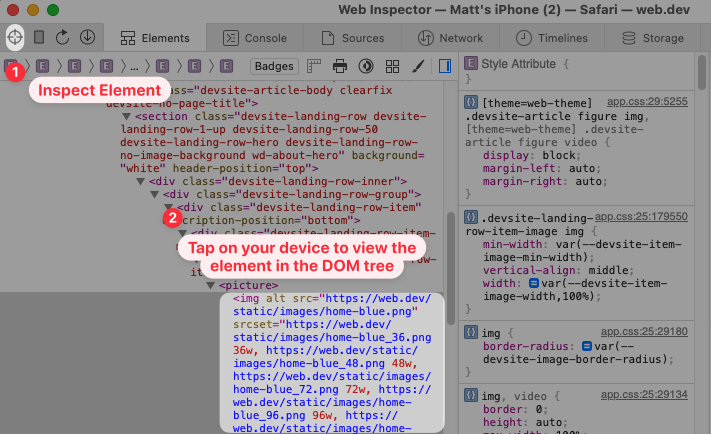
How to inspect element on iPhone and iOS
You can also enable the web inspector on your iPhone or iPad. You need to go through a couple steps to get started with remote debugging:
- Connect your device to your Mac
- Click Allow in the Allow accessory to connect dialog
- On your device, select Trust in the Trust this computer dialog
- Open the Develop menu, look for your device, and select Use for development
- On your device, open a page in Safari
- Open the Develop menu again and then select a page that's open on your device
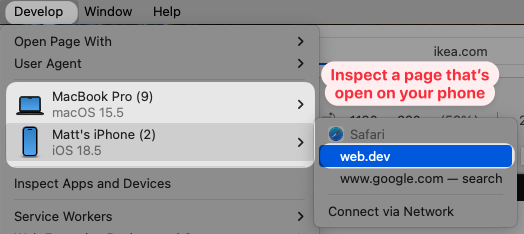
Now you're ready to use the inspect element feature on your iPhone or iPad. Click on the Start Element Selection in the Web Inspector and then tap on a UI element on your device.
Conclusion
While the Safari Web Inspector isn't as powerful as Chrome DevTools, it is still incredibly feature-packed. There are a lot of additional advanced features that we haven't mentioned here.
If you're trying to improve your website performance, check out our free website speed test as an additional tool to debug page speed issues.


Monitor Page Speed & Core Web Vitals
DebugBear monitoring includes:
- In-depth Page Speed Reports
- Automated Recommendations
- Real User Analytics Data