How to Read a Request Waterfall Chart
Network request waterfall are a powerful tool when working to improve website performance. Knowing when different page resources load provides a starting point to investigate poor performance.
This article explain how to read a request waterfall and how to detect different page speed issues.
How to generate a website request waterfall
Website waterfall analysis is supported by many web performance testing tools, for example:
- DebugBear's free Website Speed Test
- WebPageTest by Catchpoint
- The Network tab in Chrome DevTools
- DebugBear page speed monitoring
Find the request waterfall in your DebugBear test result
After running DebugBear's page speed test you can view the waterfall chart in the Requests tab.
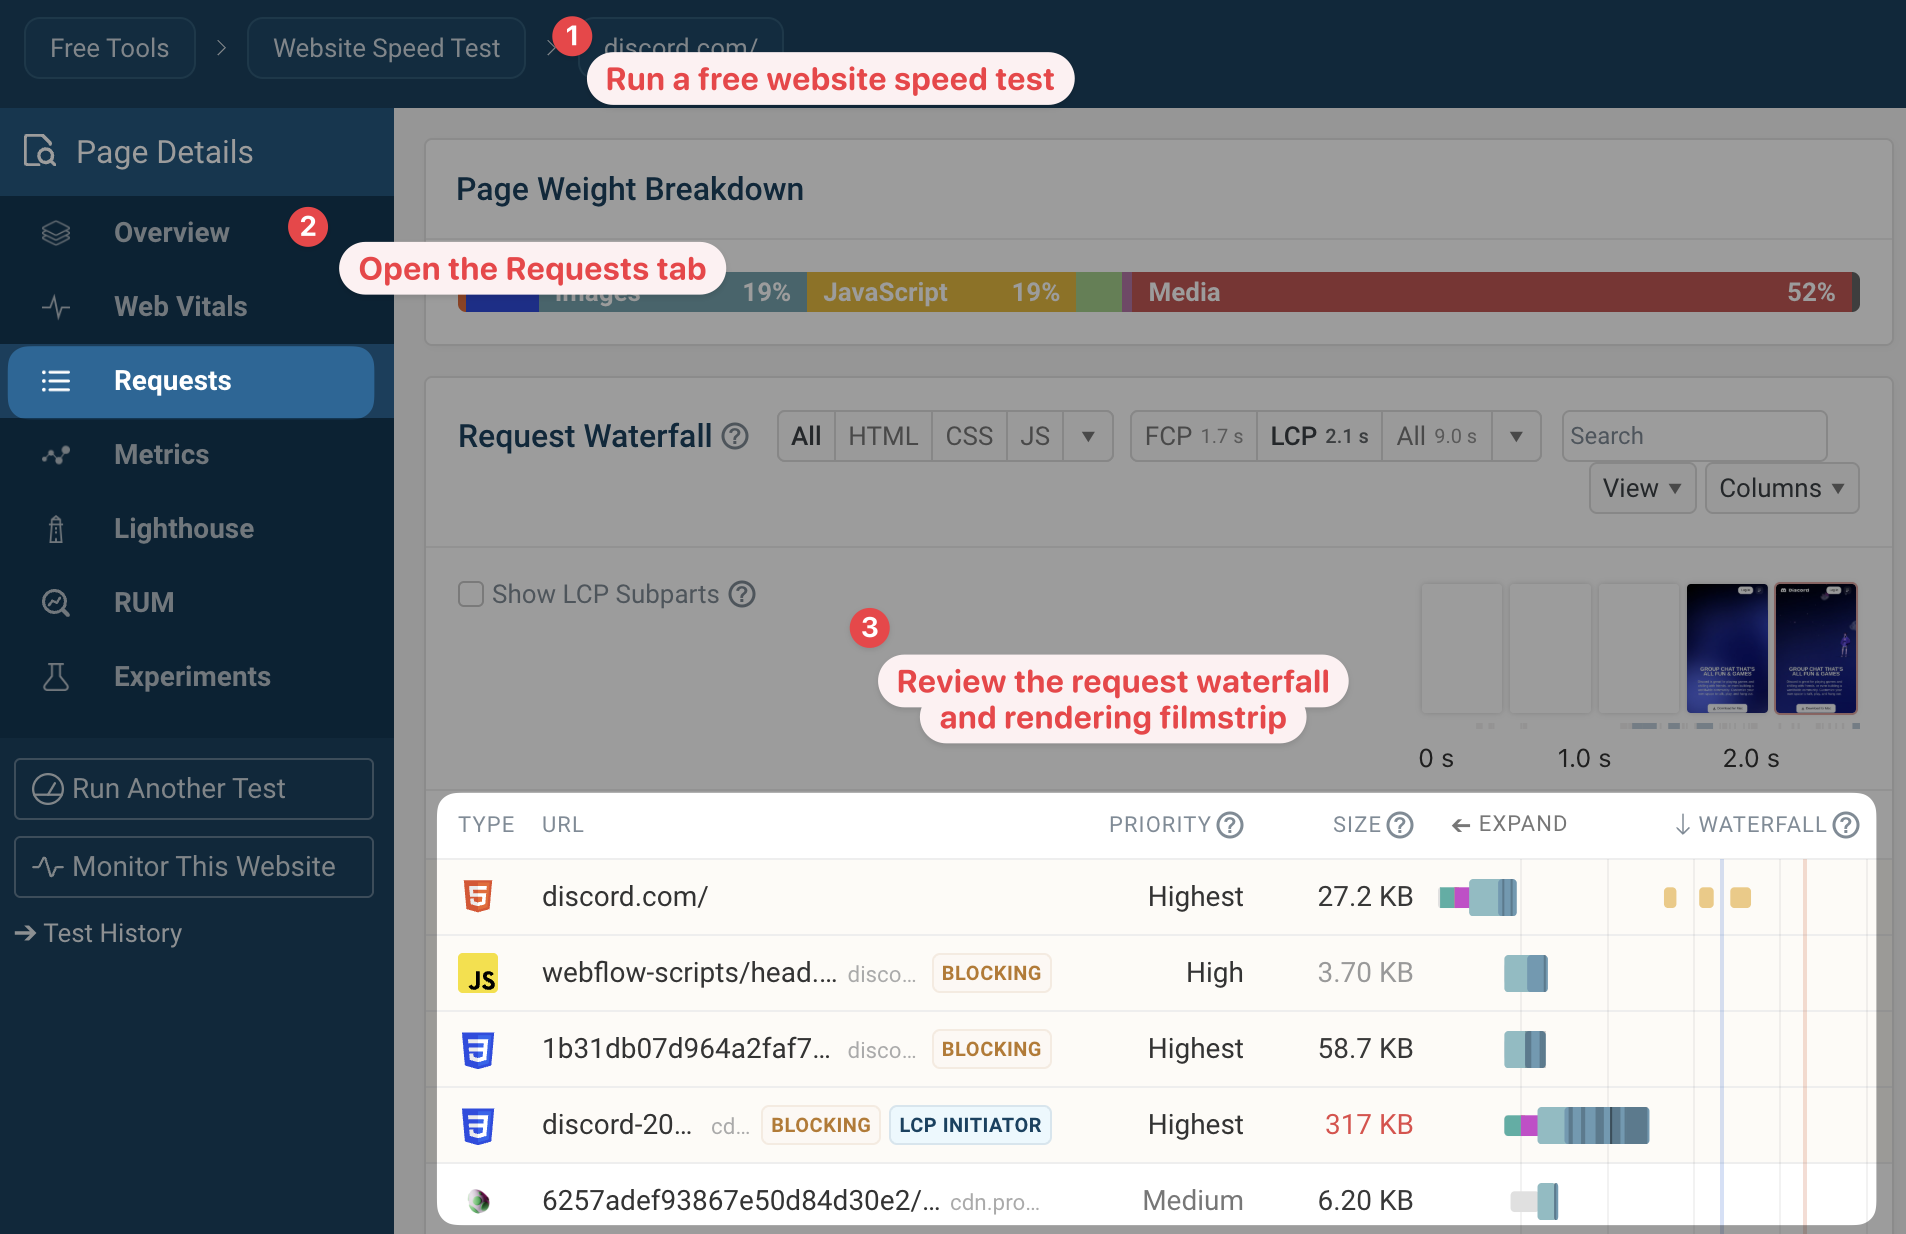
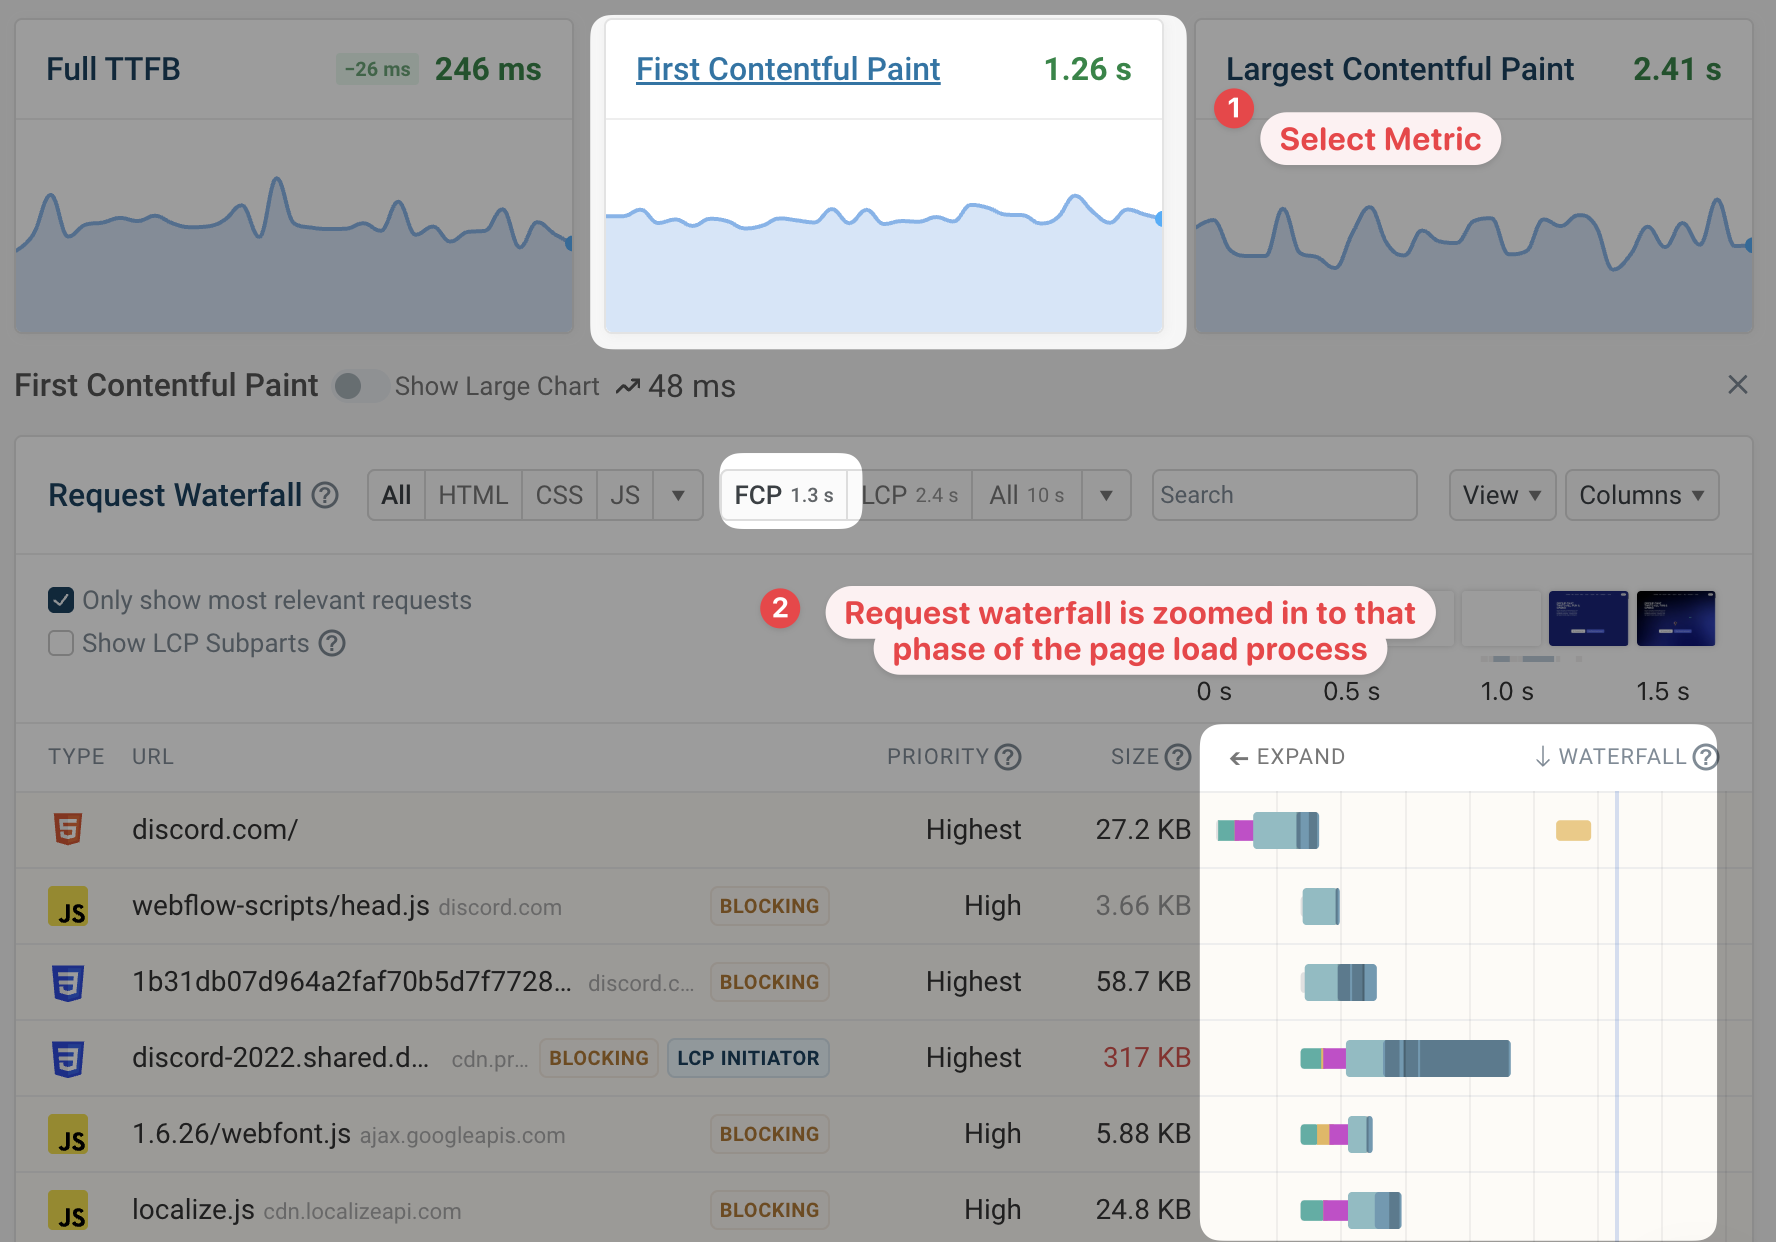
You can also click on a specific web performance metric to view relevant debug data, including a request waterfall that's zoomed in to that part of the page load process and highlights the metric timing in the waterfall.
How to read a request waterfall: an introduction
Each waterfall chart is a list of resources the browser loads when opening the page. Usually the requests are in chronological order, so you can see the HTML document request at the top. After that, other resources like CSS, JavaScript, and images start to load.
The actual waterfall chart appears to the right of the request URLs. For each request, the waterfall indicates when the resource started to load and when it finished loading. Because it starts the page load process, the HTML document is placed on the left of the waterfall.
The length of the waterfall bar indicates how long the request takes. The bar itself consists of different components, like wait time, time spent connecting to the server, or time spent downloading the resource.
To make web performance optimization easier, page speed tools also provide additional information for each request. For example:
- The priority the browser assigned to the request
- The server response time
- The download size of the resource
- Whether the request is render-blocking
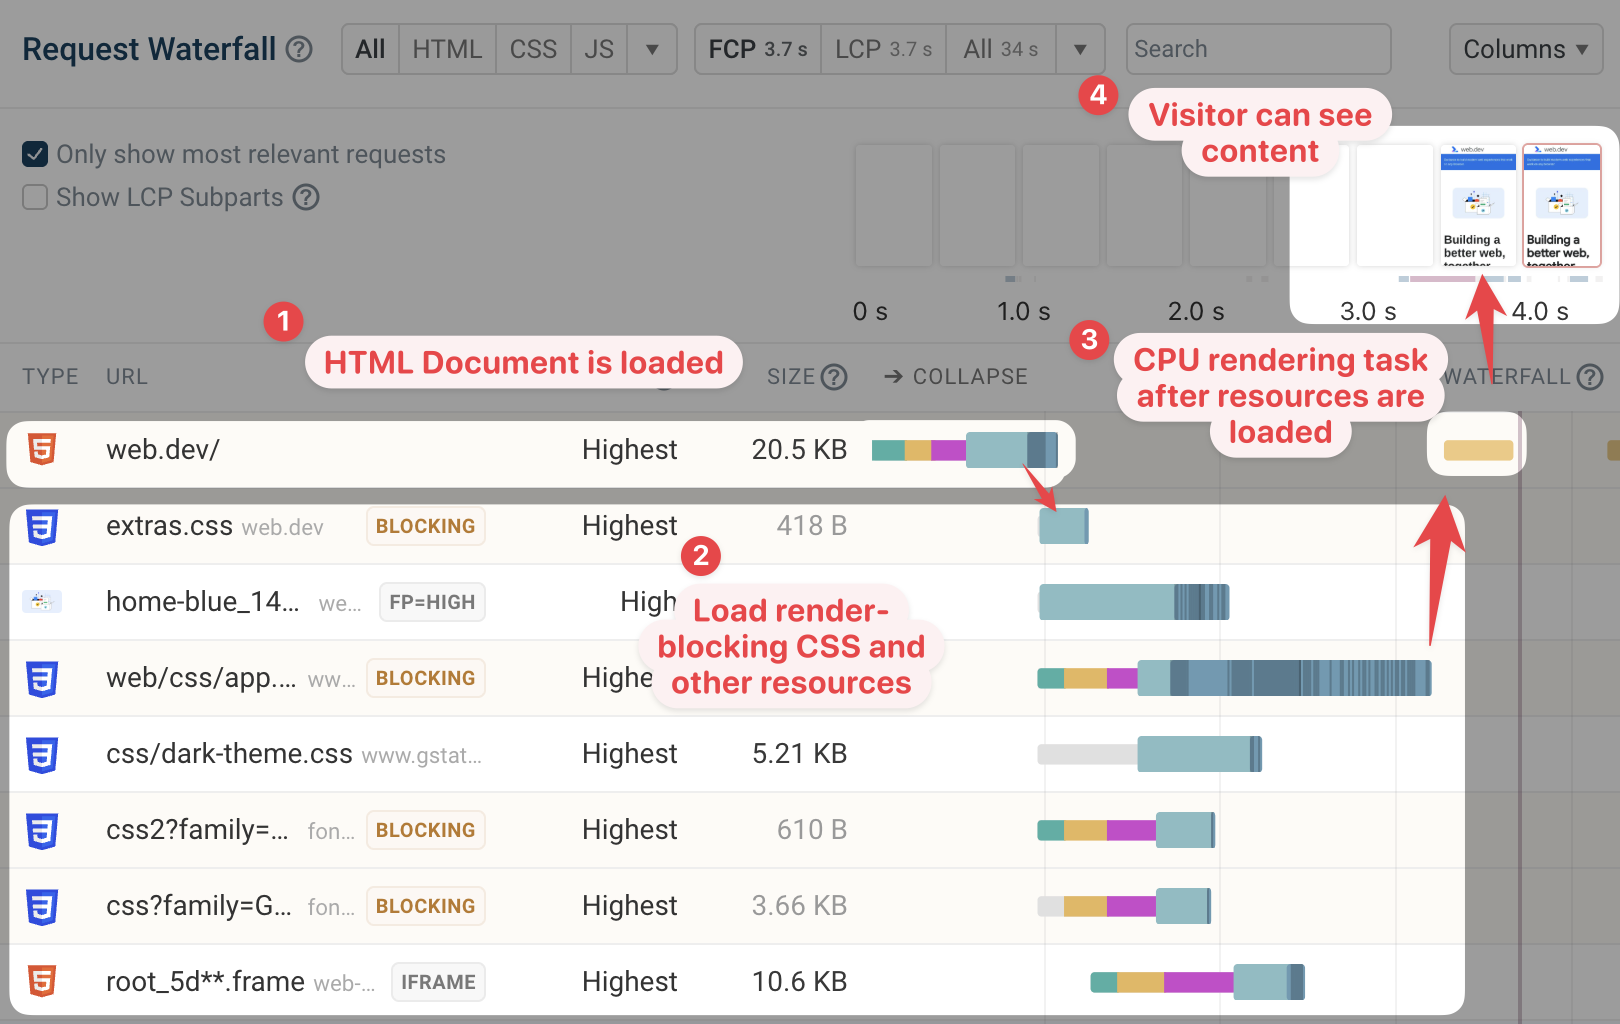
To understand the page load process it's often helpful to contextualize network activity with other factors impacting load time. The rendering filmstrip on top of the waterfall chart shows what the visitor can see at any given point.
After loading all necessary resources the browser also needs to spend time processing those resources and use them to render the page. In the waterfall above you can also see when this main thread CPU task takes place.
Components of each network request
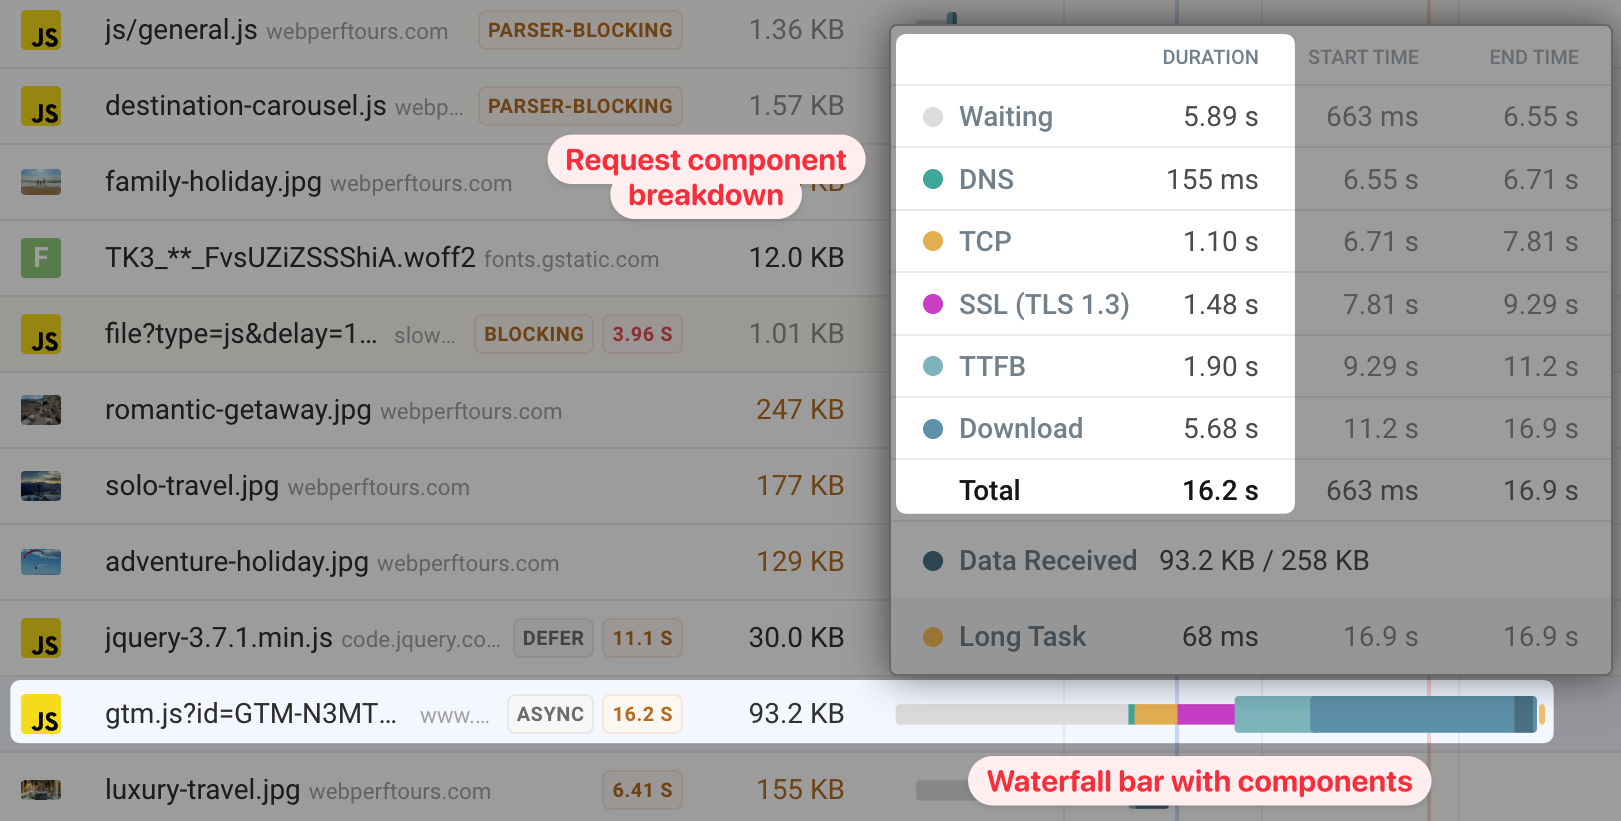
The duration of each network request can be broken down into components:
- Wait or queue time: the browser knows about the resource but is instead prioritizing other resources
- Server connection time: DNS/TCP/SSL steps needed to establish a server connection
- Request TTFB: Time spent waiting for the server to respond
- Download time: how long it takes to transfer the resource over the network
Hover over each request in the waterfall to view this breakdown.
Server connections
To load a resource from a website, the browser first needs to establish a connection to the server. Establishing a connection consists of three stages:
- DNS: getting an IP address for the server based on the domain name, for example converting
example.comto93.184.216.34 - TCP: establishing a reliable way of communicating with the server
- SSL: establishing a secure/encrypted way of communicating with the server
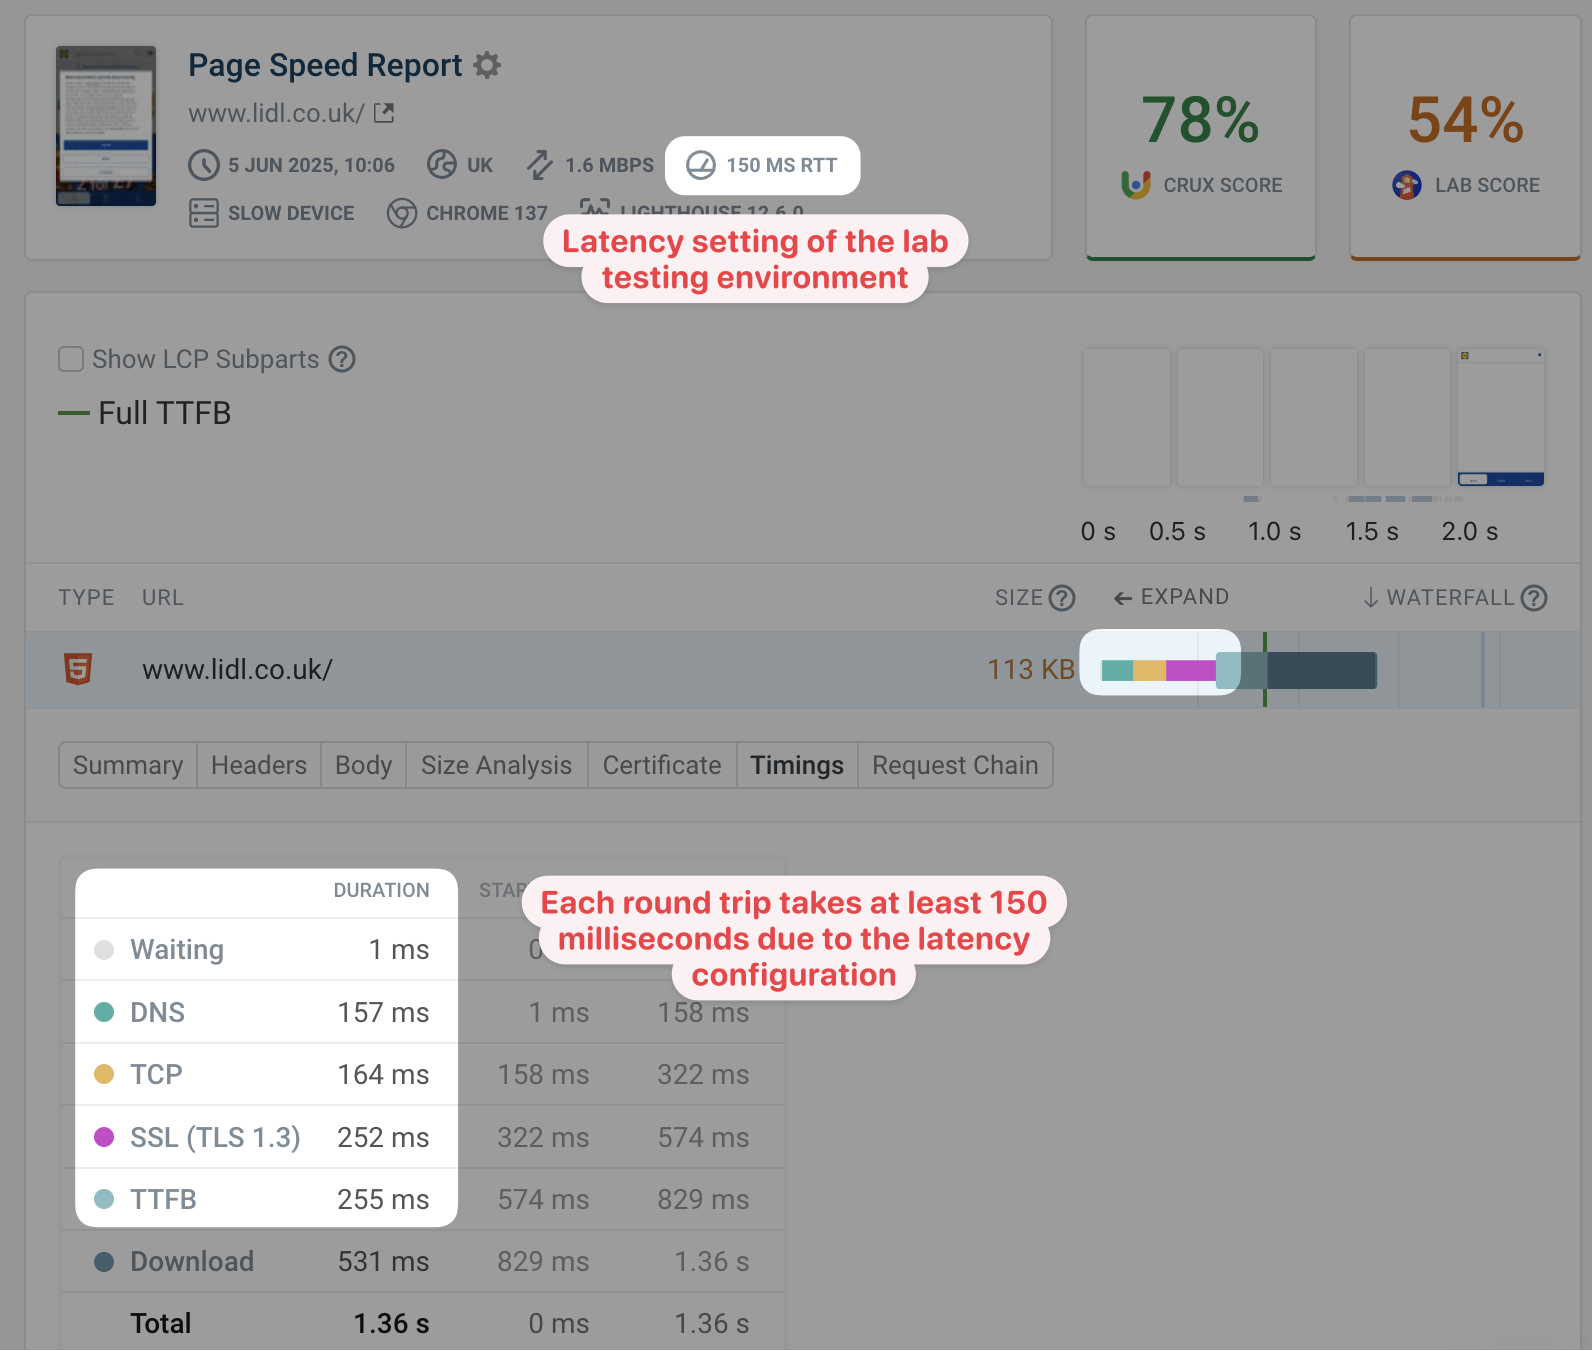
These steps are done sequentially and each requires at least one network round trip between the browser and a server on the internet. When connecting to a nearby server on a fast wifi connection each round trip might take 5 milliseconds. However, on a slow connection or when connecting to a far-away server, each round trip can take several hundred milliseconds.
Page speed testing tools are run from a data center with an internet connection that's much faster than a typical visitor. Because of that, they usually throttle the network to add round trip latency for a more realistic test result. For example, Lighthouse and PageSpeed Insights simulate a round trip latency of 150 milliseconds when testing on mobile devices.
When looking at your test result you'll find that each connection component takes at least as long as the configured network latency.
Connecting to multiple different servers and connection re-use
Most websites today don't just load resources from one server, but use third-party services to load different parts of the page. Each new server the browser needs to connect to requires a new server connection to be created.
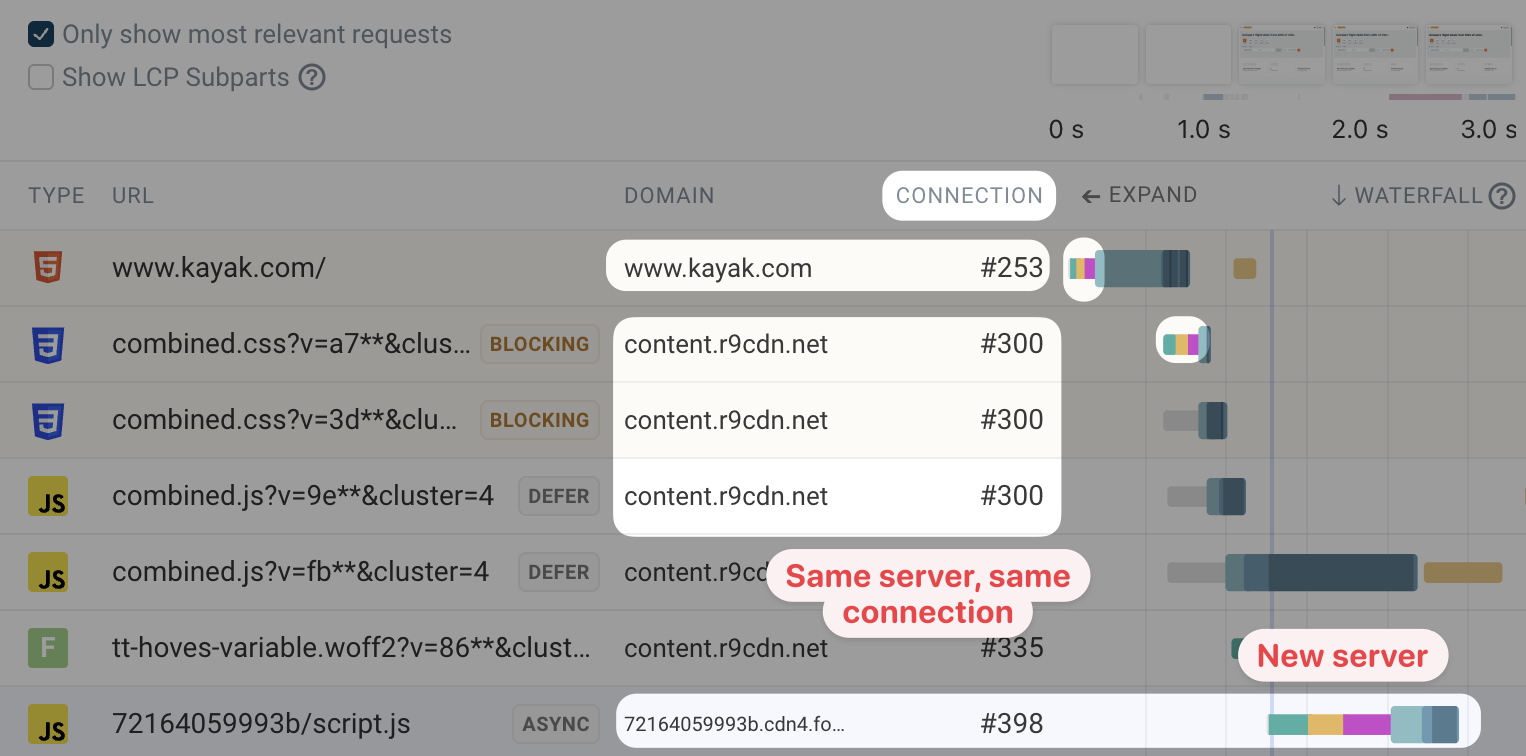
Once a connection has been created it can be used for multiple requests, at least if the server supports the HTTP/2 protocol. The waterfall chart below shows that the browser is loading three different files from the content.r9cdn.net domain. Each request uses connection number 300.
However, you can also see that this is a different connection from the one used to load the document HTML. And a script.js file later on also need sanother server connection.
Rendering milestones and LCP subparts
The waterfall describes exactly what's happening when loading a page, but usually we look at page speed in the context of different web performance metrics. For example, First Contentful Paint (FCP) and Largest Contentful Paint (LCP) measure how long it takes for different page components to appear after the browser starts loading the page.
These metrics are often integrated into the request waterfall to make optimizing them easier. For example, by default the DebugBear request waterfall shows the vertical lines indicating the FCP and LCP rendering milestones.
You can also view the LCP subparts that are required to load the largest content image on your page. Understanding how much each subpart contributes to your overall Largest Contentful Paint score allows you to focus on your optimizations where they have the most impact.
Sequential request chains
Once a resource has been loaded it can start a request to load another resource. For example a JavaScript file loading JSON data with a fetch request. These sequential request chains can slow down the page.
If you expand a request in the DebugBear waterfall you can use the Show request initiator chain option to view the requests leading up to the selected request.
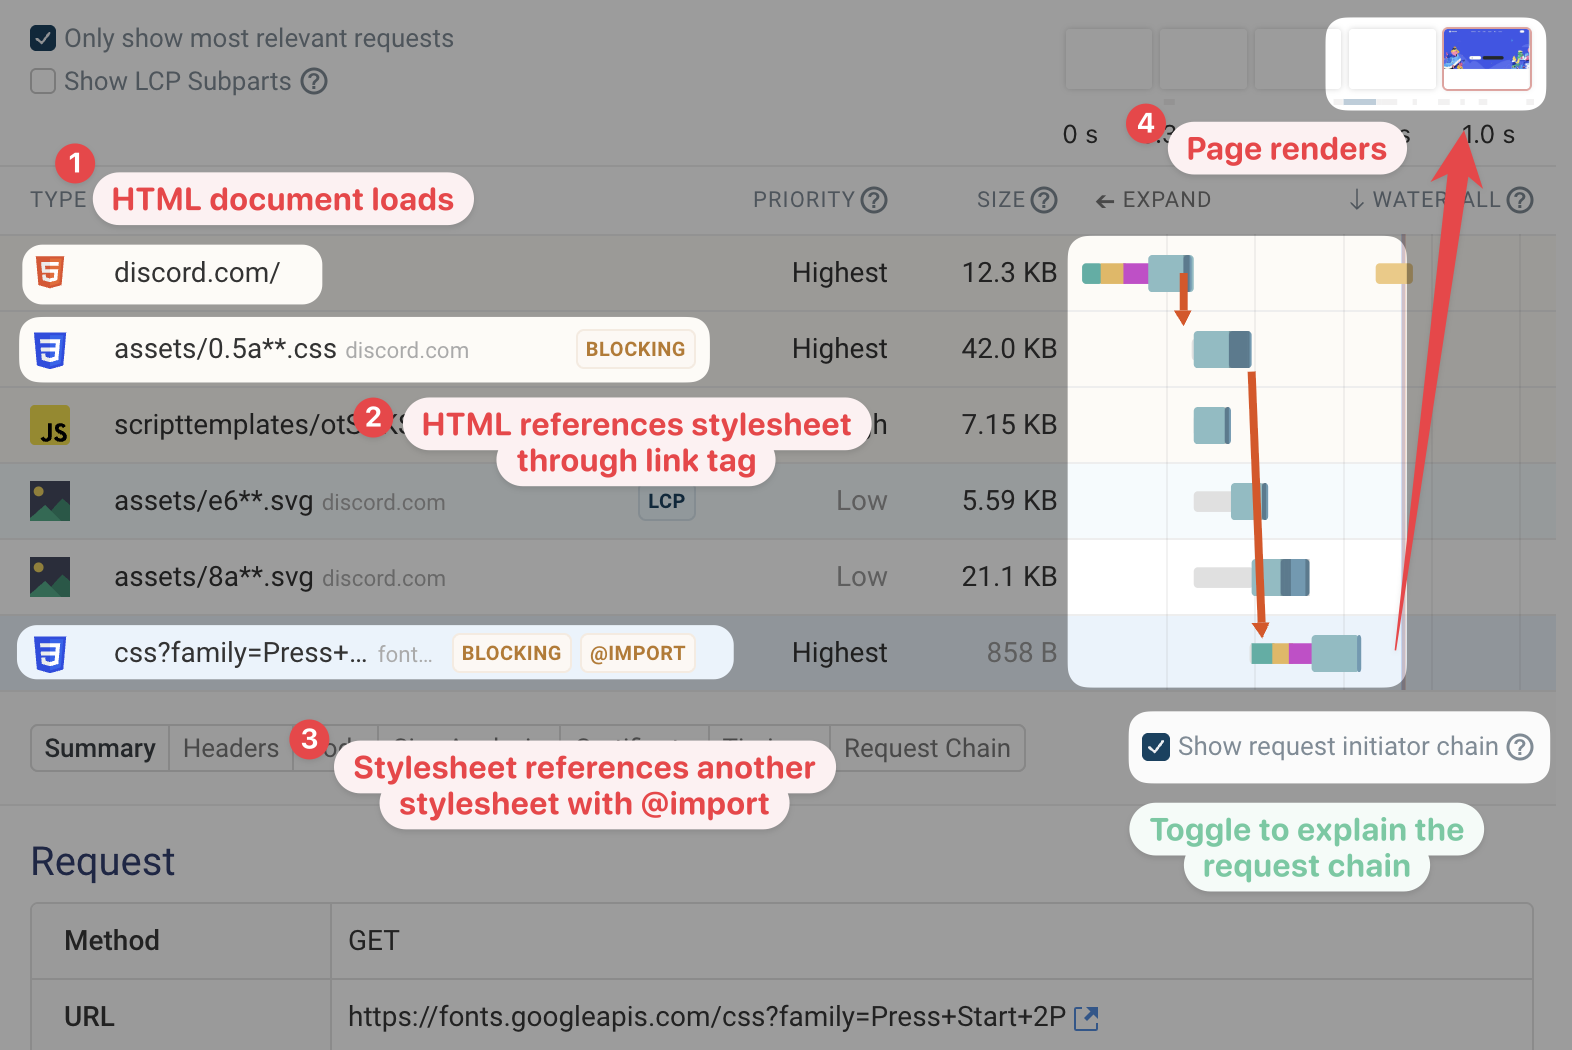
In this example we can see that:
- The HTML document loads first
- A
<link>tag in the HTML triggers loading a CSS stylesheet - A CSS import in the stylesheet references another CSS file
- Page content renders once both render-blocking CSS files have fully loaded
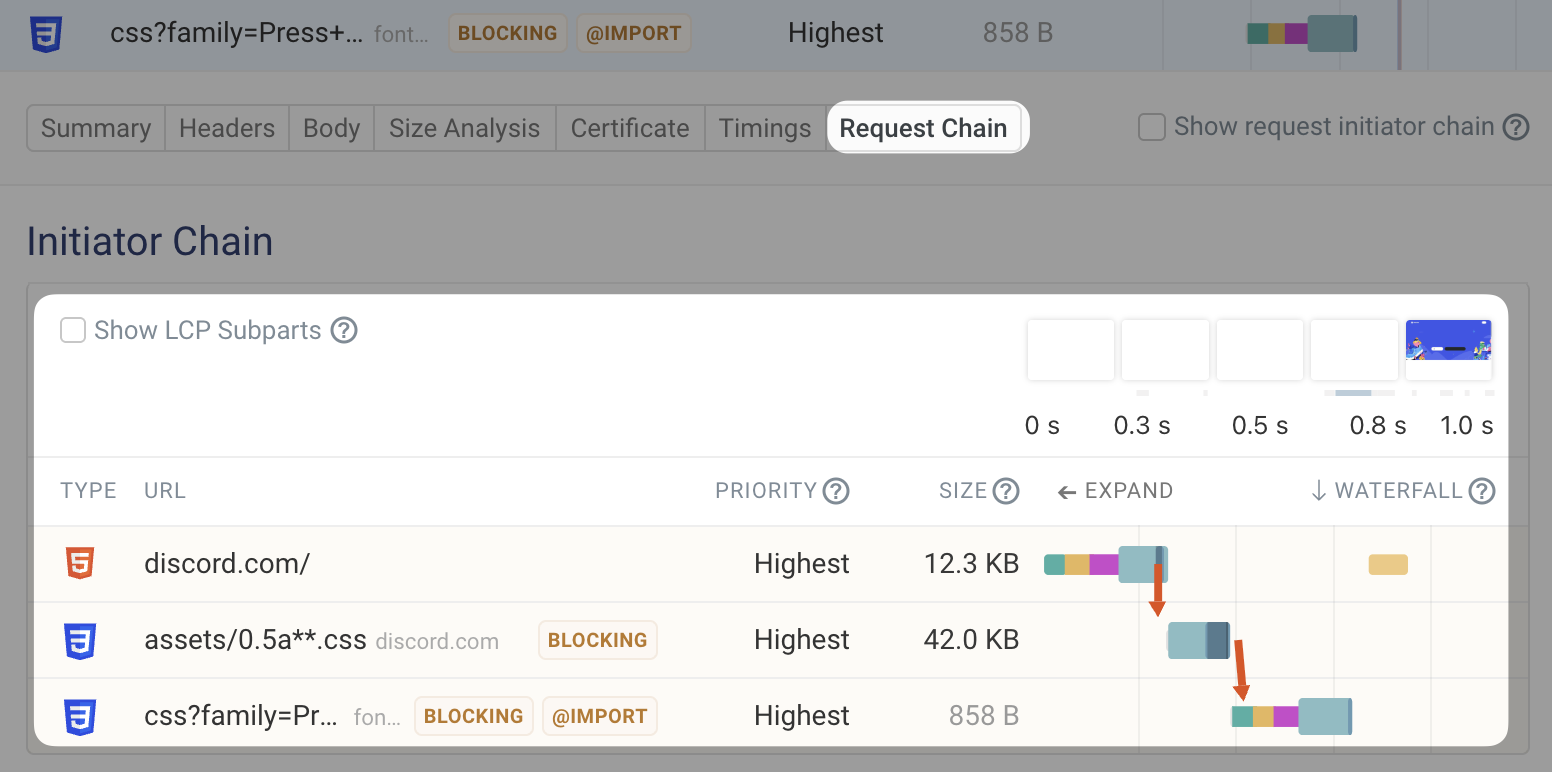
You can also use the Request Chain tab for the expanded request to view a waterfall view of just the requests involved in loading the current resource.
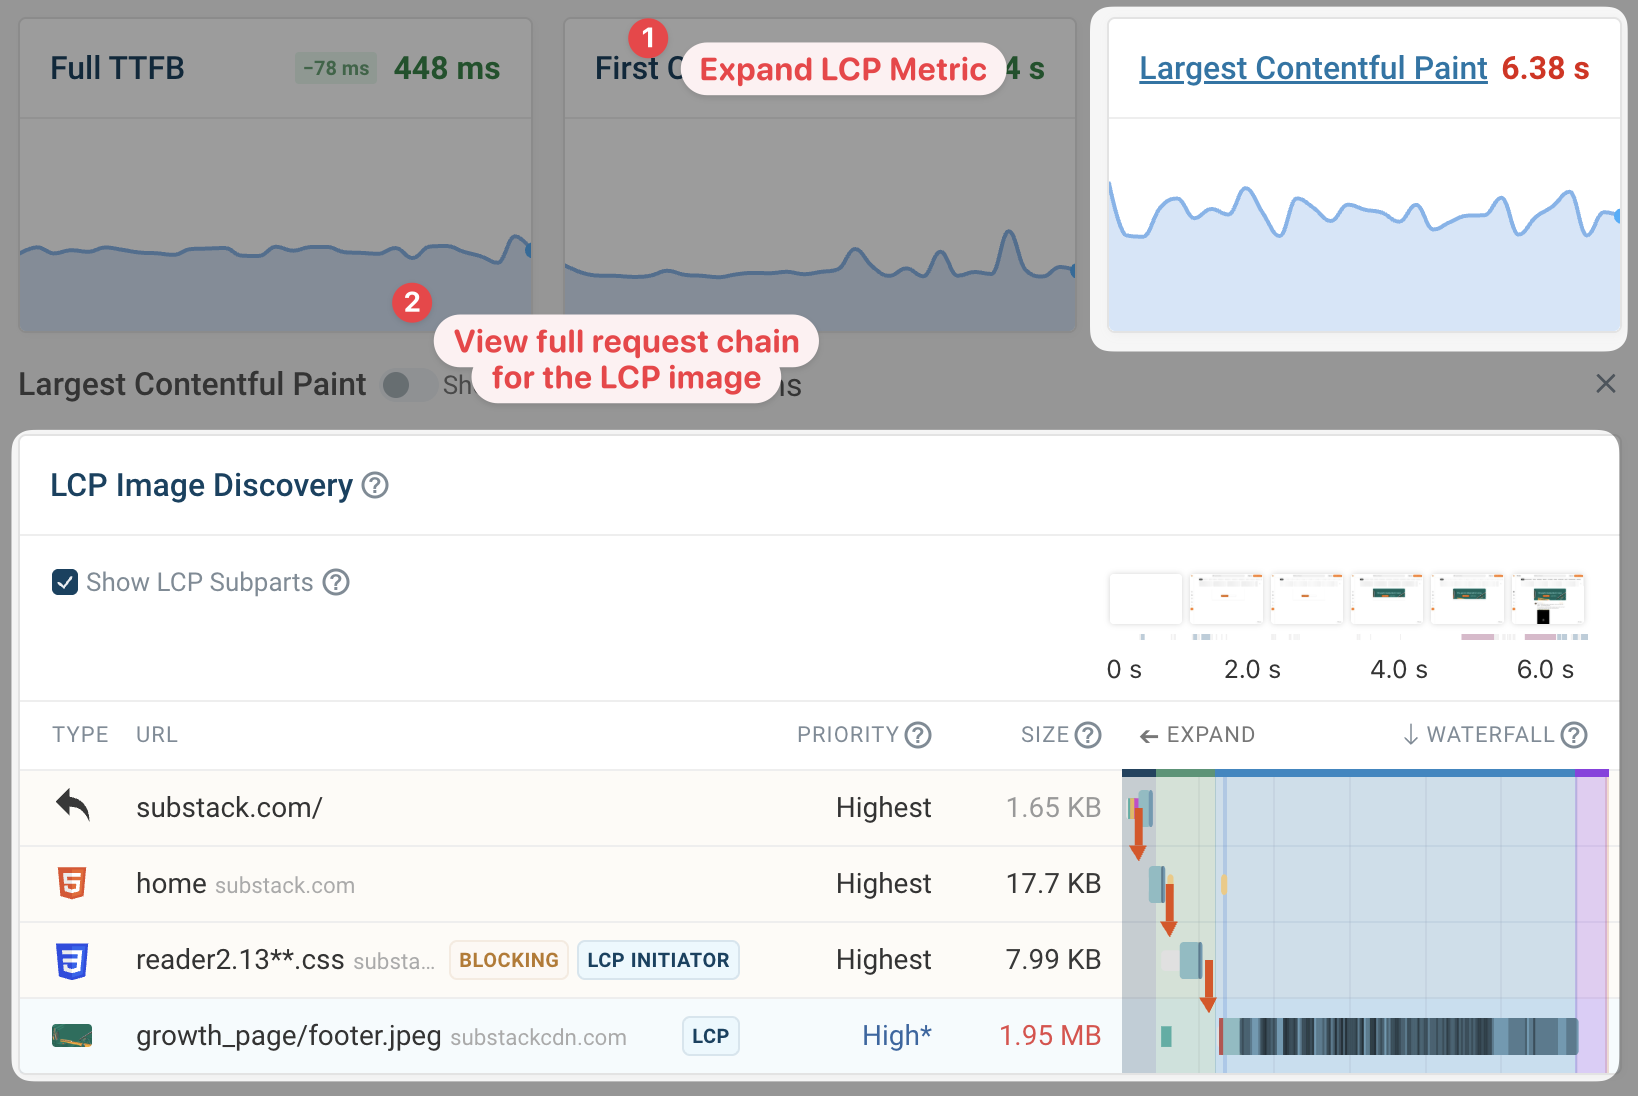
If you want to see how the Largest Contentful Paint image is discovered by the browser, then you can click on the LCP metric in your DebugBear test result.
You'll then be able to see all the requests that happen in sequence in order to load the main image on the page.
Comparing request waterfalls
Often the reason to look at a request waterfall is because you've seen a regression in your performance metrics. Some performance tools allow you to look at a before and after comparison to see what caused the regression.
In DebugBear, you can enable Compare mode by clicking on the Compare button at the top of the page.
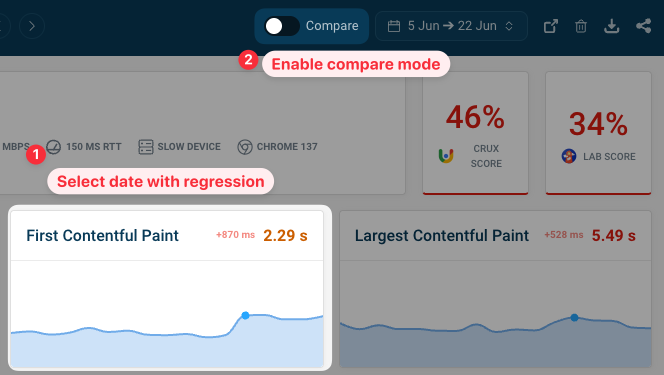
Enabling the comparison view means you can see:
- Any new resources loaded by the page
- How rendering progress is impacted by the change
- Whether the size of existing resources has changed
- Whether resources are loading slower or faster
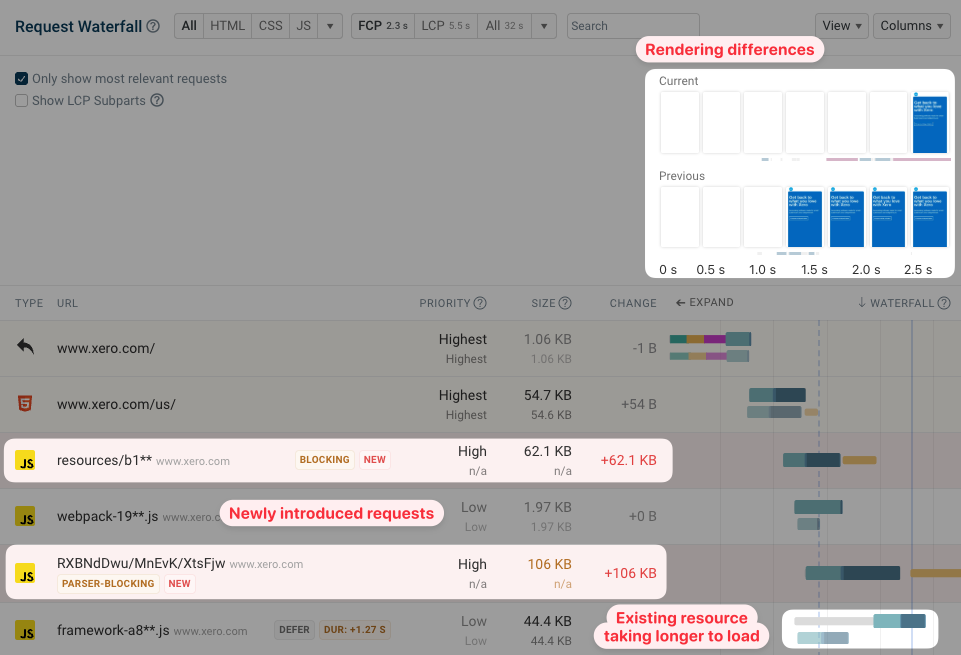
In the example above you can see that two new render-blocking resources were added to the page. As a result, the page appears blank for longer.
We can also see a low-priority result that now takes longer to load as network capacity is used up by the more new more important requests.
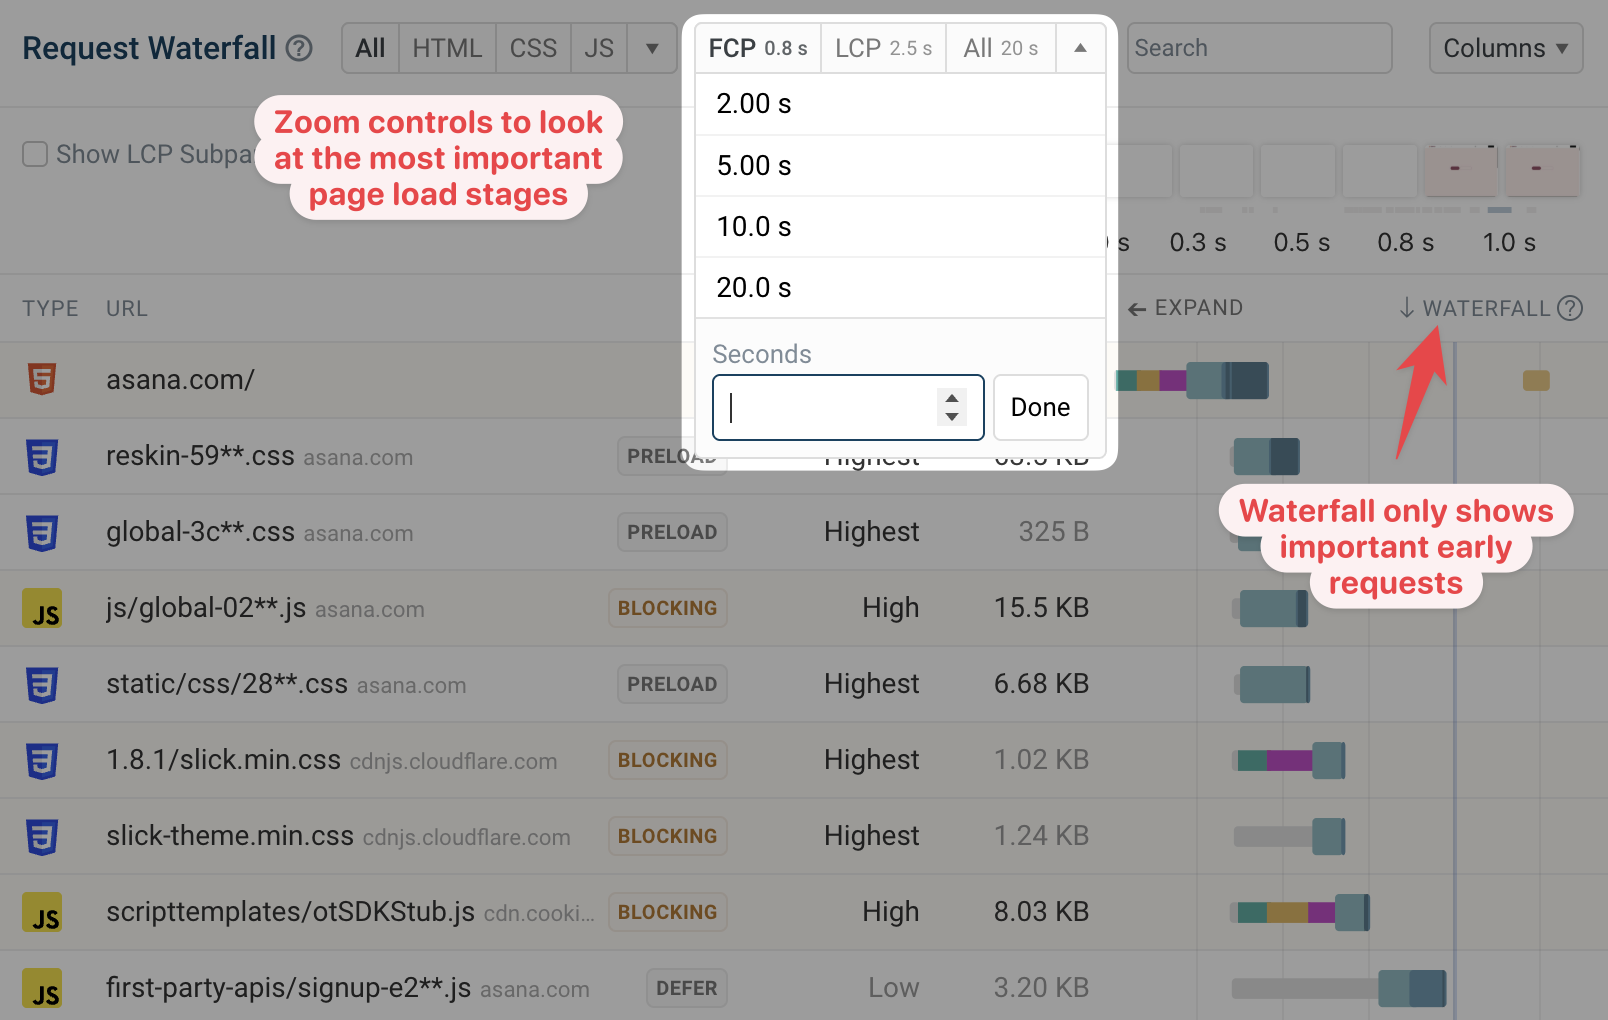
Zooming in on parts of the waterfall
Many pages keep making network requests for well over 10 seconds. But those later requests aren't critical to the initial page load process.
Usually it's helpful to instead zoom in on the early loading stages to see how the initial page load time can be optimize.
You can select a pre-defined milestone like FCP and LCP, or set a custom zoom level.
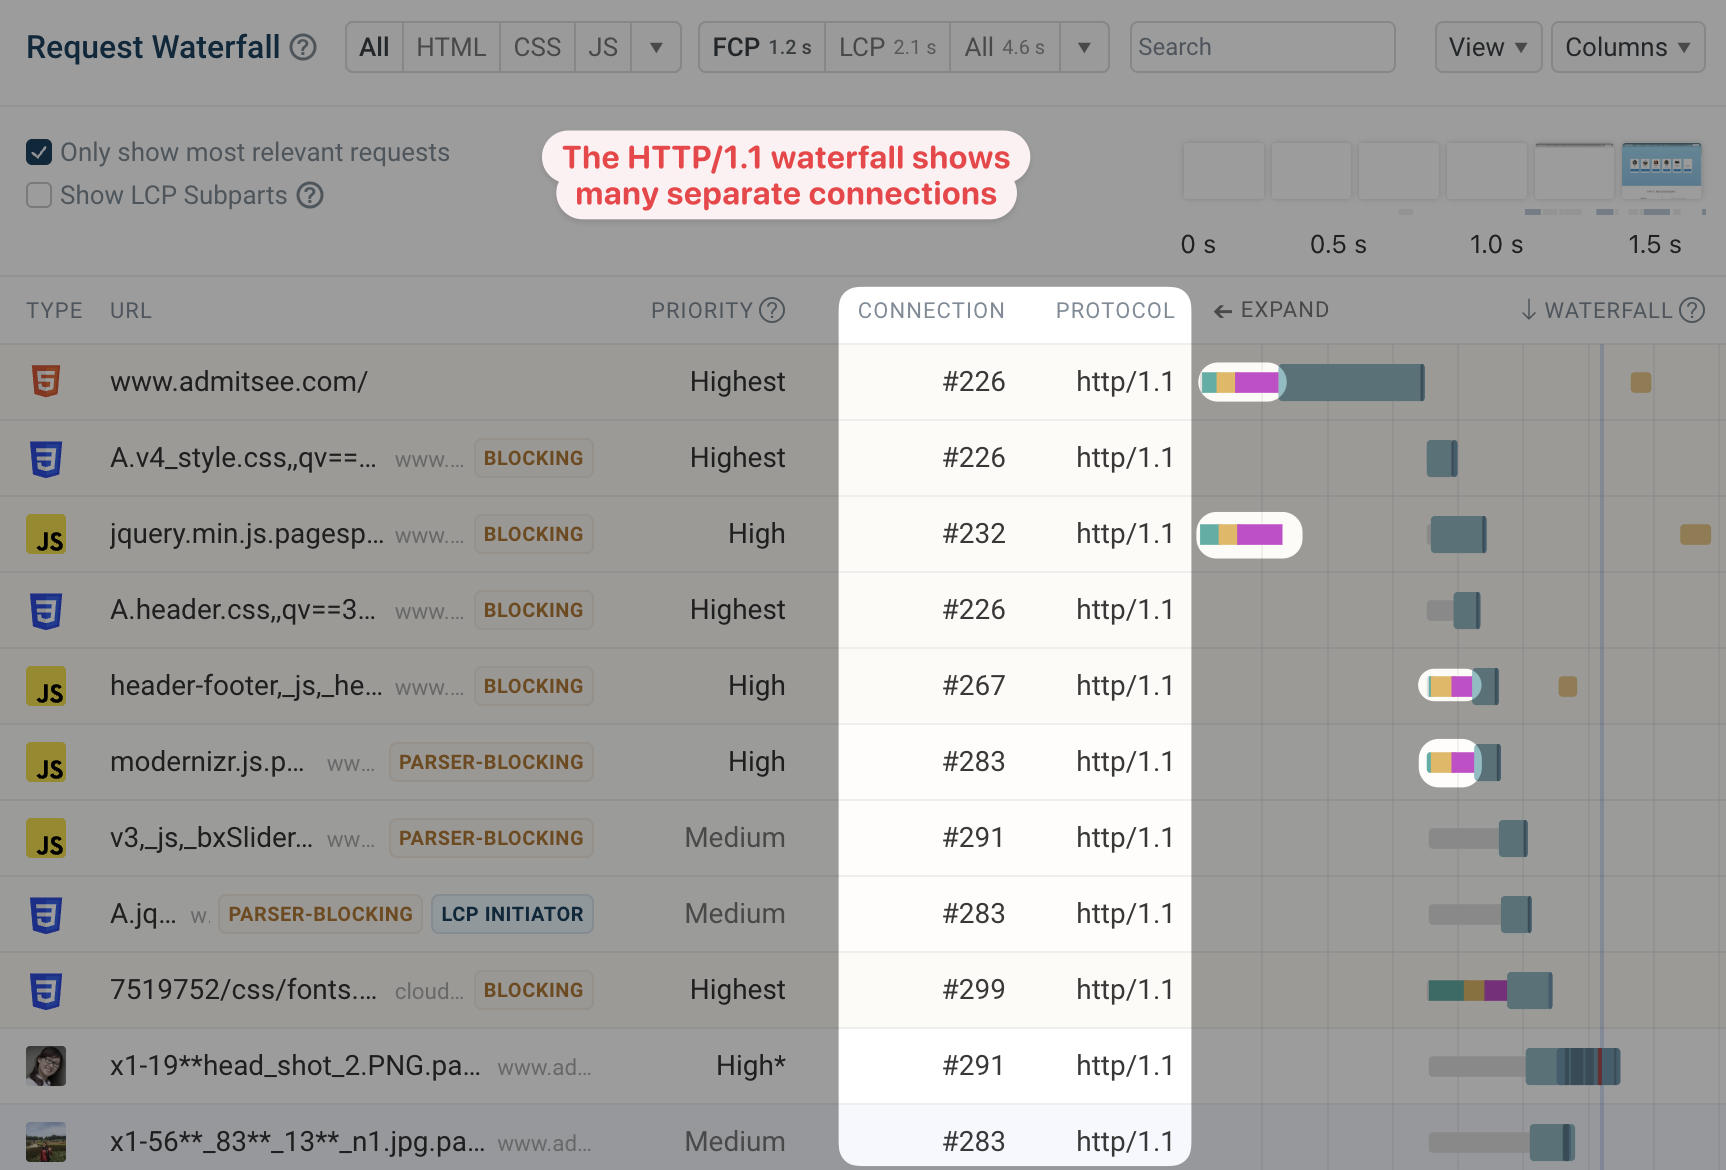
HTTP/1.1
Prior to HTTP/2, each server connection could only be used to make one HTTP request at a time. To make multiple concurrent requests, browsers needed to create multiple connections to the same origin.
The waterfall view below shows a website using HTTP/1.1. We've used the Columns selector to show the protocol and connection ID for each request.
The waterfall column shows multiple separate connection being created for the same website server. Once a request is complete, an existing connection can be used again for a new request.
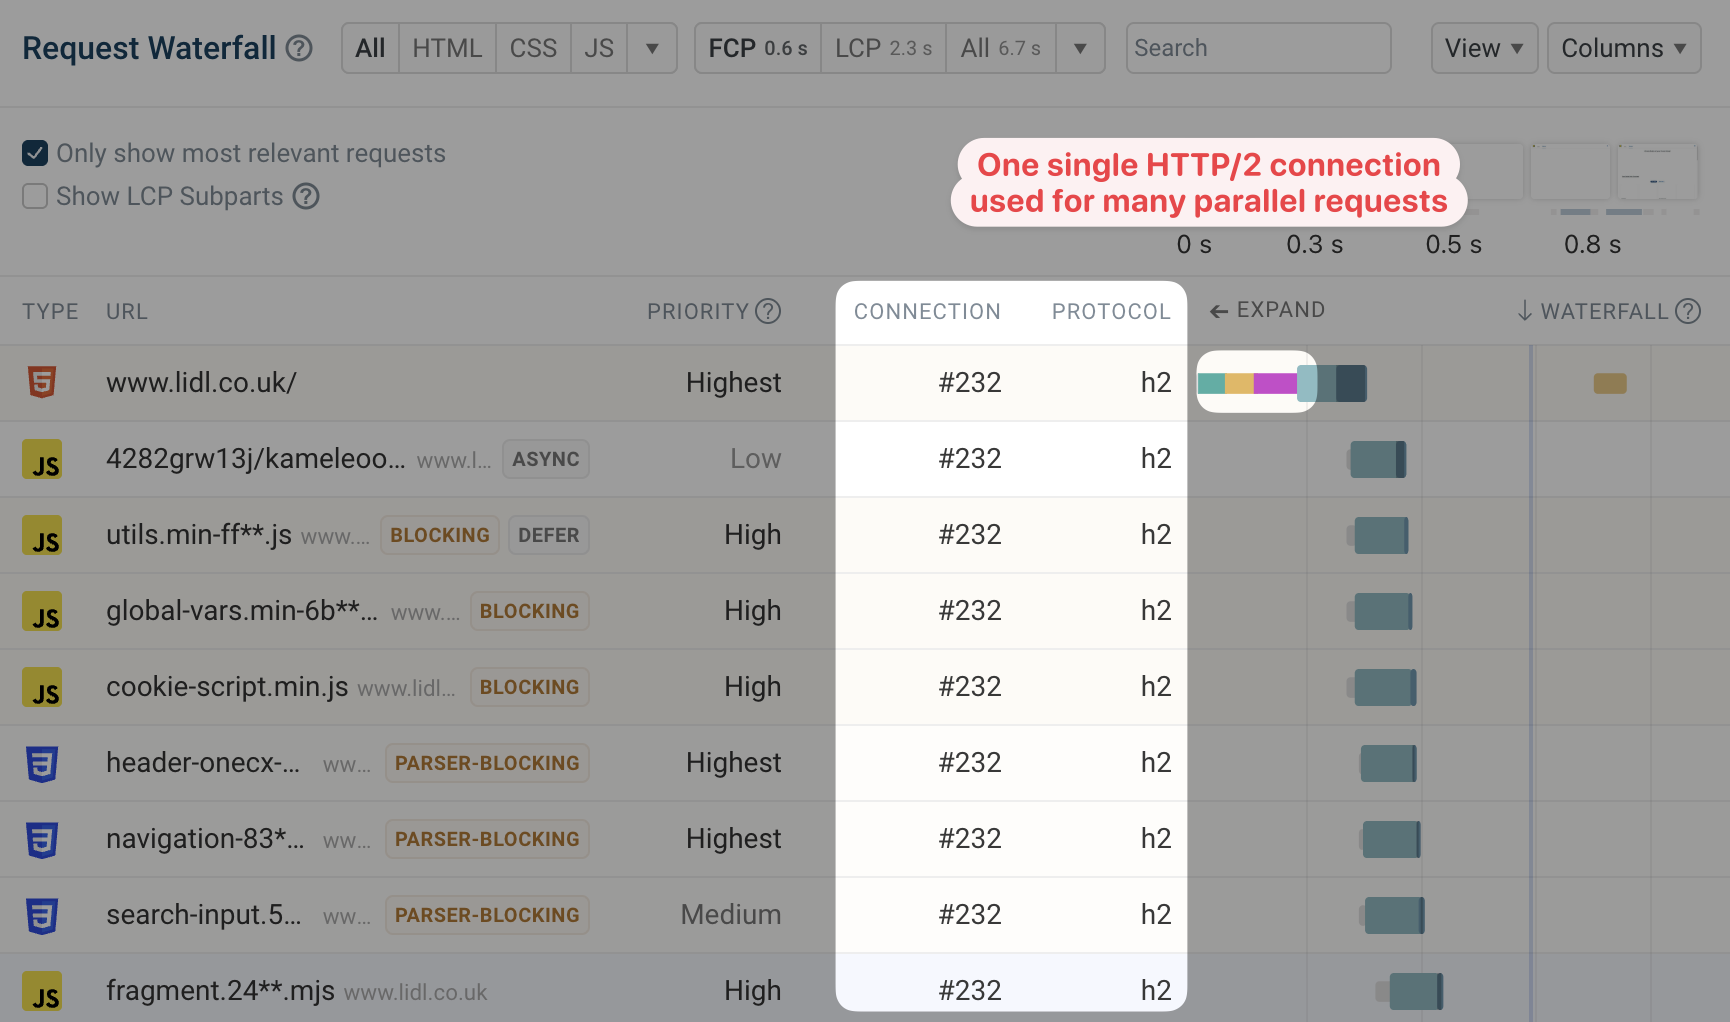
In contrast, the HTTP/2 waterfall shows just a single server connection that's used to load several resources at once.
Each request has the same connection ID and the waterfall column only shows a single connection being set up at the start of the page load process.
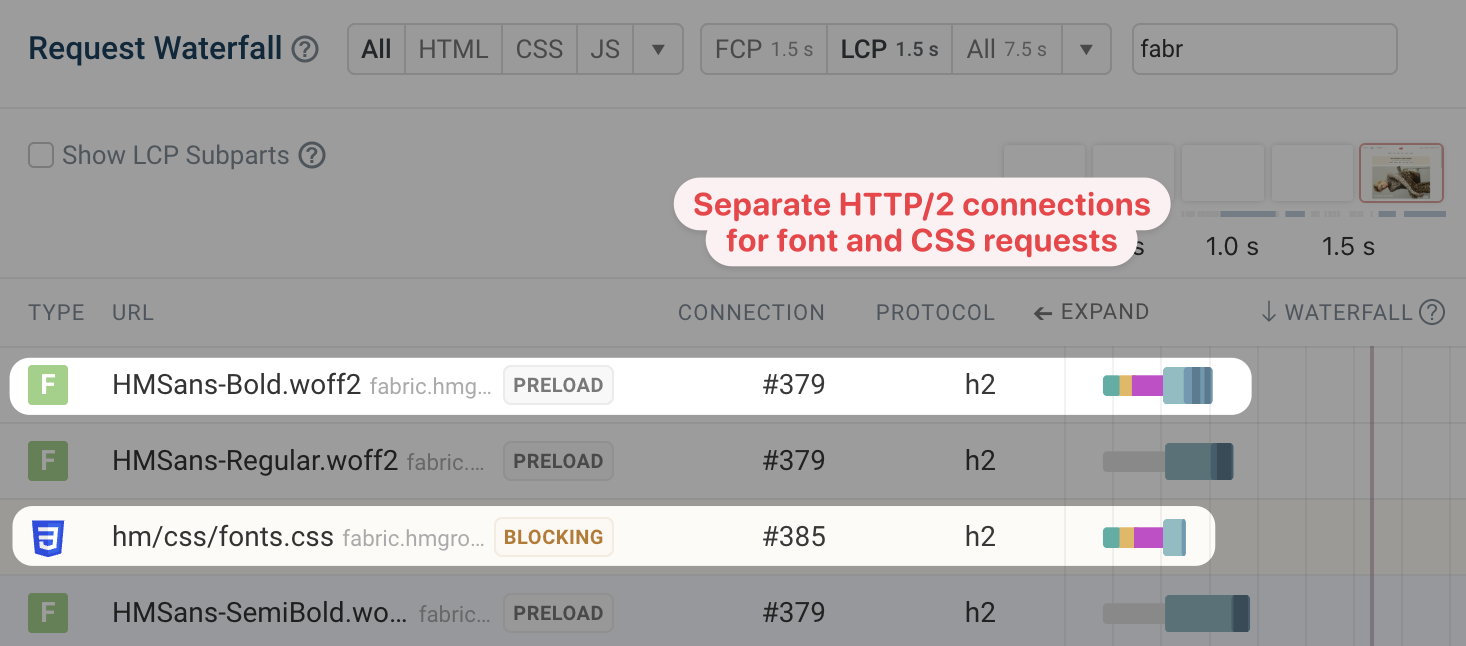
Non-credentialed requests
Sometimes HTTP/2 requests to the same domain end up using separate connections anyway. This happens because credentialed and non-credentialed requests can't share a connection in most browsers.
This tends to be most noticeable with font requests, which are never loaded with credentials (like cookies for example). JavaScript modules or resources loaded with the crossorigin="anonymous" attribute will also use a non-credentialed connection.
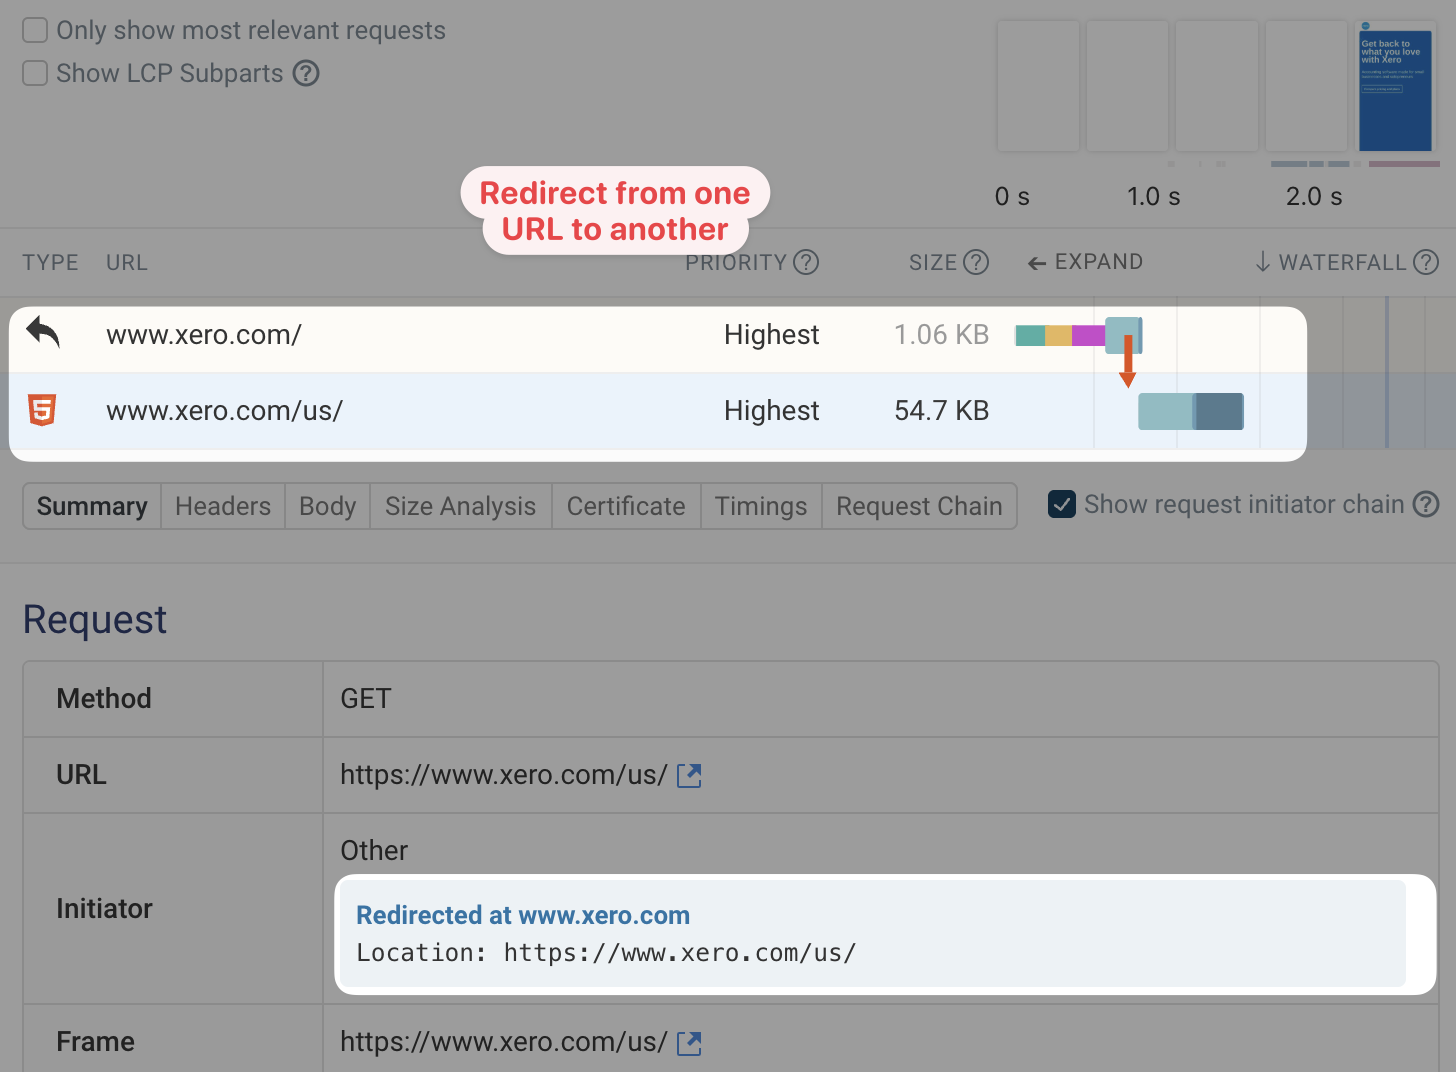
HTTP Redirects
If a resource has moved to a different URL, servers respond with a redirect response. Redirect chains and other unnecessary redirects can increase the time visitors have to wait until they can see page content.
In this example, www.xero.com/ redirects to www.xero.com/us/. The second request URL is provided in the Location response header of the first request.
Request priority
Each network connection only has a limited amount of capacity, and browsers try to allocate those resources to the most important request first. If a request is low-priority it will be delayed until later on in the page load process.
This waterfall shows an example of that. The top of the page references a bunch of render-blocking and that need to be high-priority. HTML <script> tags in the body section of the page only block rendering of content below them, so they Chrome assigns them a medium priority.
Scripts with the async or defer attribute don't block rendering, so they can be loaded with low priority. Images using the loading="lazy" attribute can also safely be loaded later on.
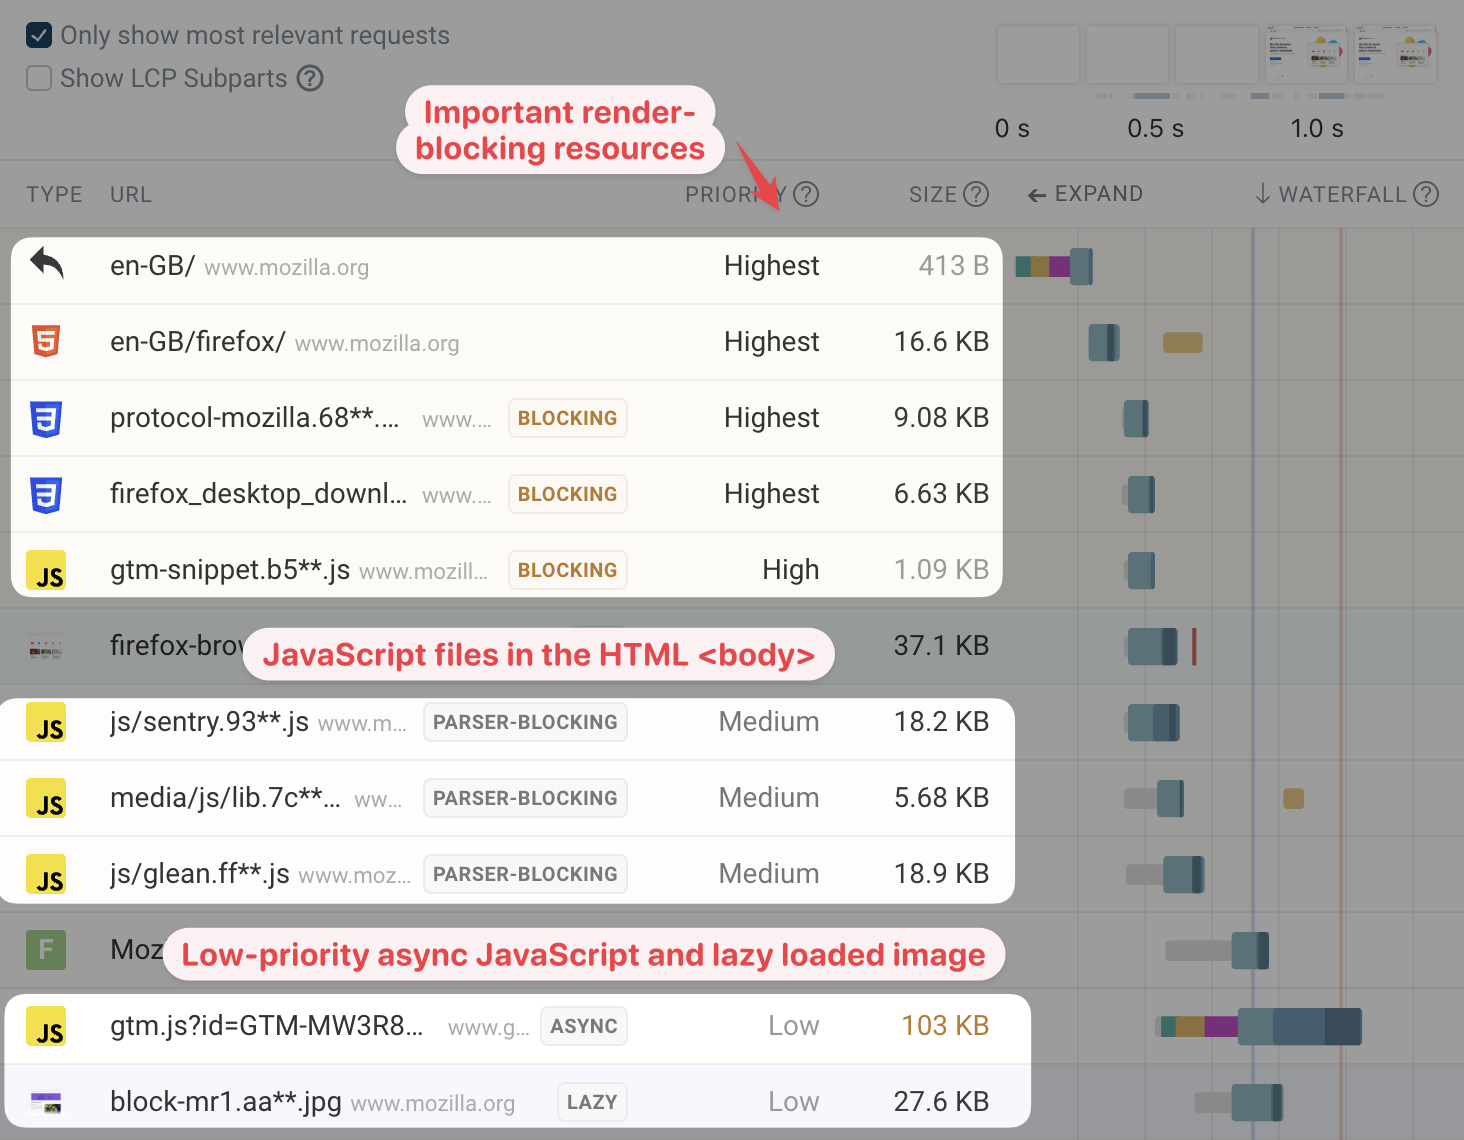
Chrome prioritizes image content by identifying the first five images on the page and assigning them a medium priority. Other images are low-priority by default.
Changes to request priority
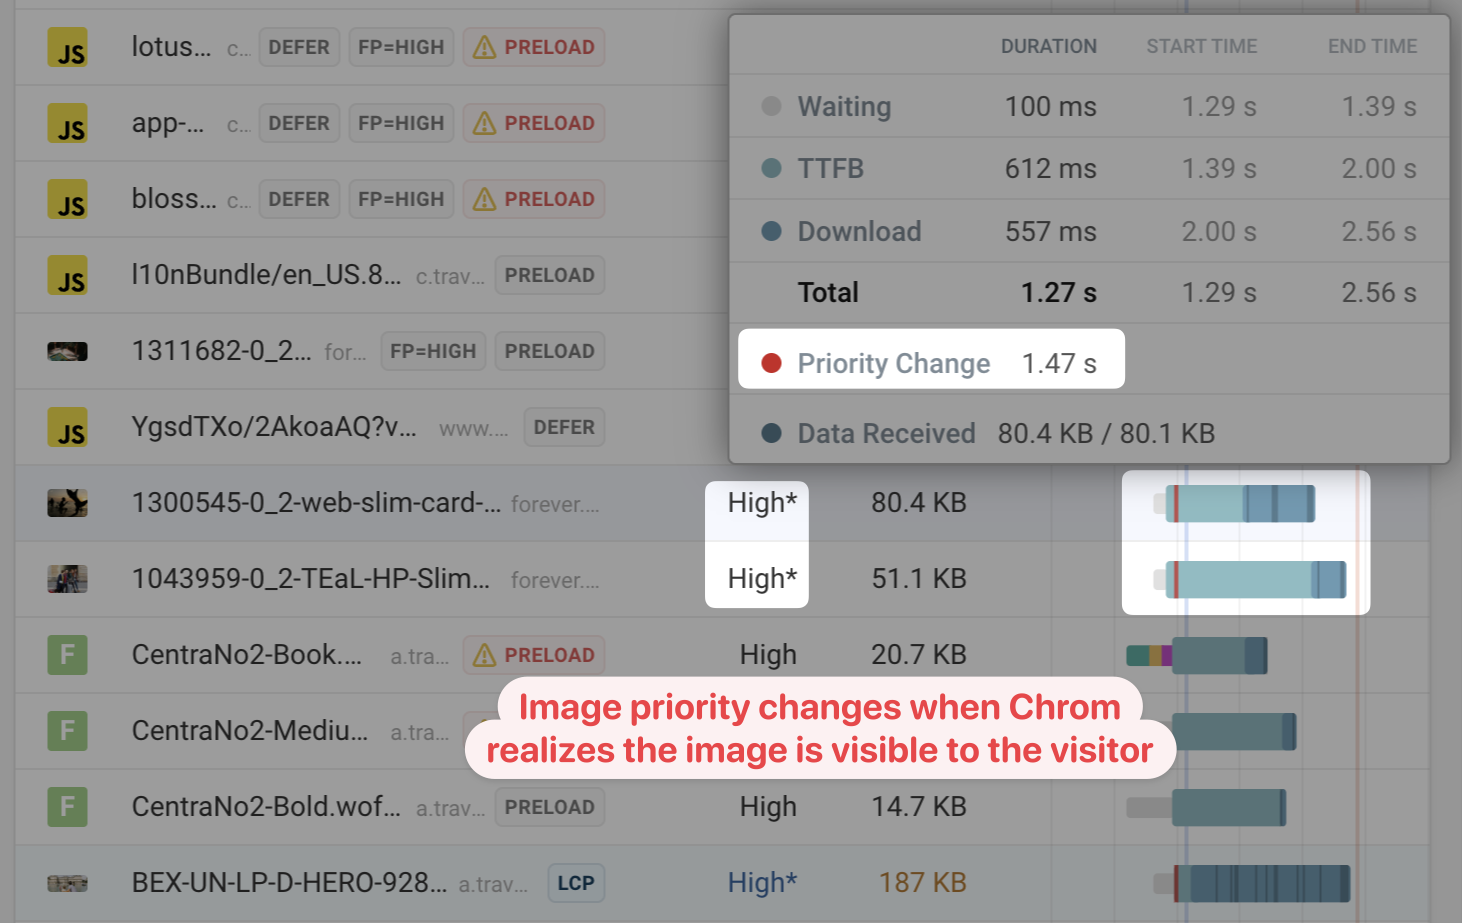
Browsers have automatic logic for determining the priority of a resource. For images in particular, the browser gains new information once the page starts rendering. When the browser realizes that an image is in the viewport it bumps the image request priority to high.
The waterfall below shows an image that initially has a low priority. Around the First Contentful Paint milestone, indicated by the blue line, the browser becomes aware that this image is in the part of the page the user can currently see. The request data then shows a priority change to high, indicated by the red line on top of the waterfall bar.
Request badges
Badges in the request waterfall provide additional information about the request. For example, the waterfall shows:
- Resources that are preloaded
- Priorities assigned by the
fetchpriorityattribute - Scripts that don't block rendering because of the
asyncordeferattributes - Whether an image is responsible for the Largest Contentful Paint
- If an image only loads when it's in the viewport due to the
loading="lazy"attribute - Resources that are loaded by an iframe rather than the main frame document
- Whether a resource is prefetched
- Whether a request was triggered by early hints
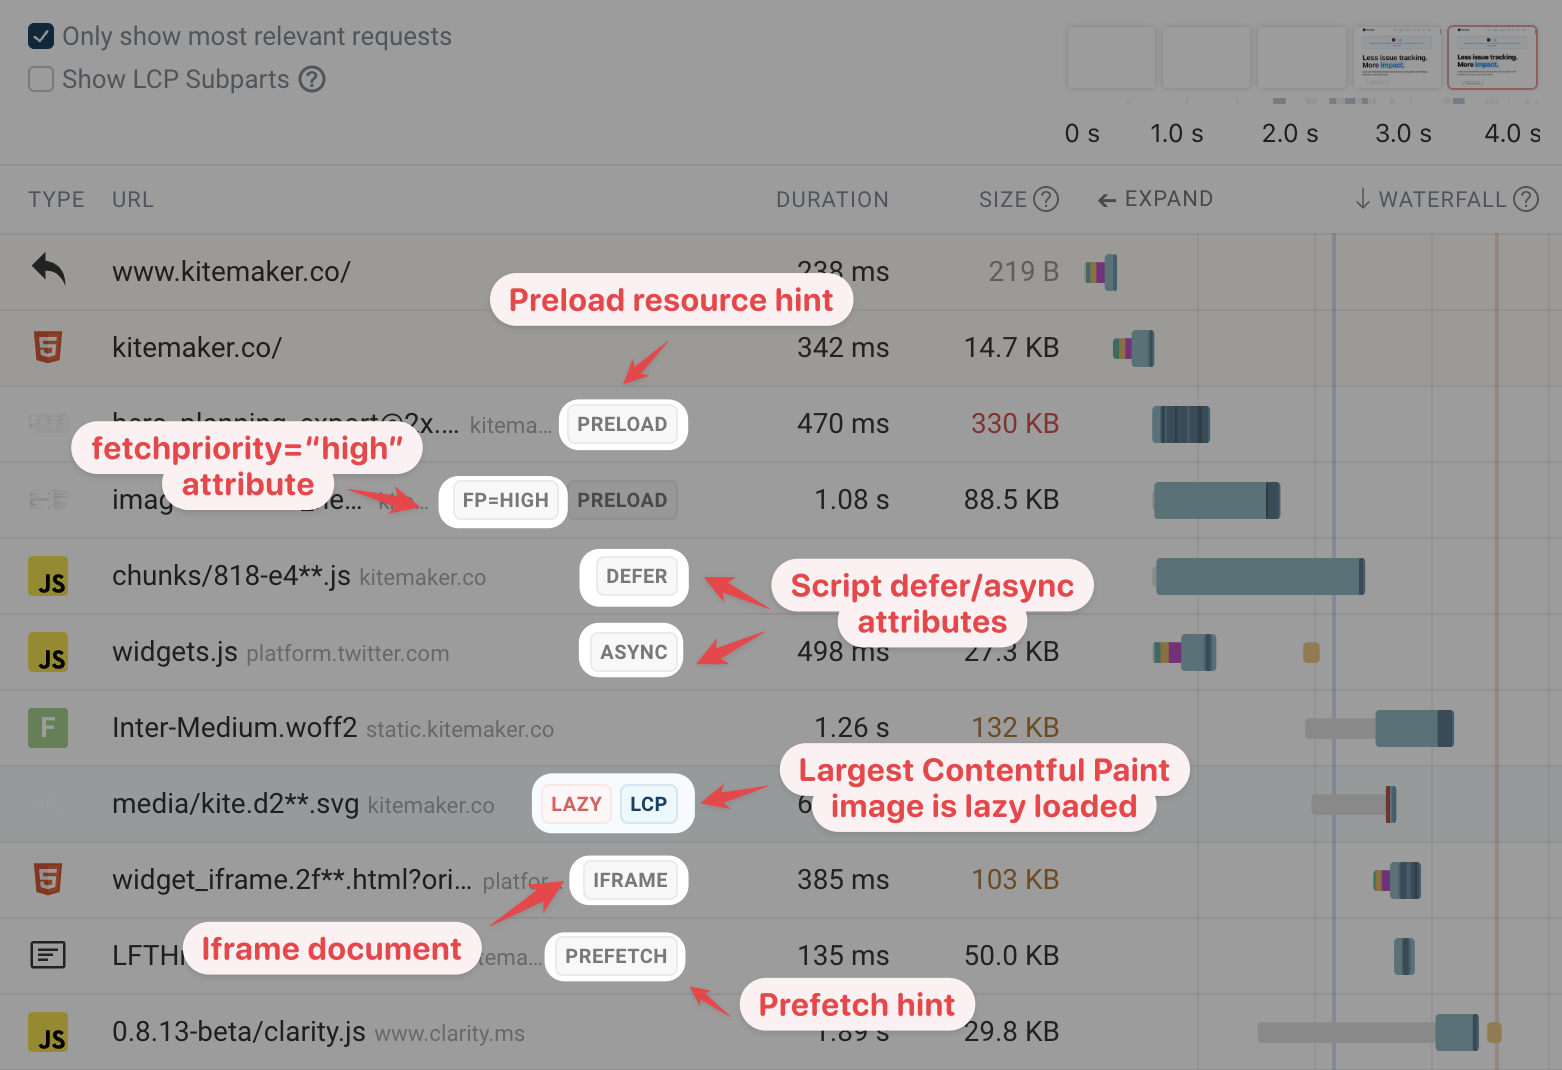
The screenshot above shows an LCP image that's loaded lazily. That's a problem, because the browser will only start loading the main image once it's started rendering the page and knows what content is in the viewport.
Impact of download size on load time
In addition to the client-server round-trips required to request a resource, downloading the response can also take a significant amount of time. How long depends on the amount of network bandwidth available on the visitor connection.
This waterfall shows a small resource that finishes loading in under a second. In contrast, the 900 kilobyte JavaScript file takes over 8 seconds to load.
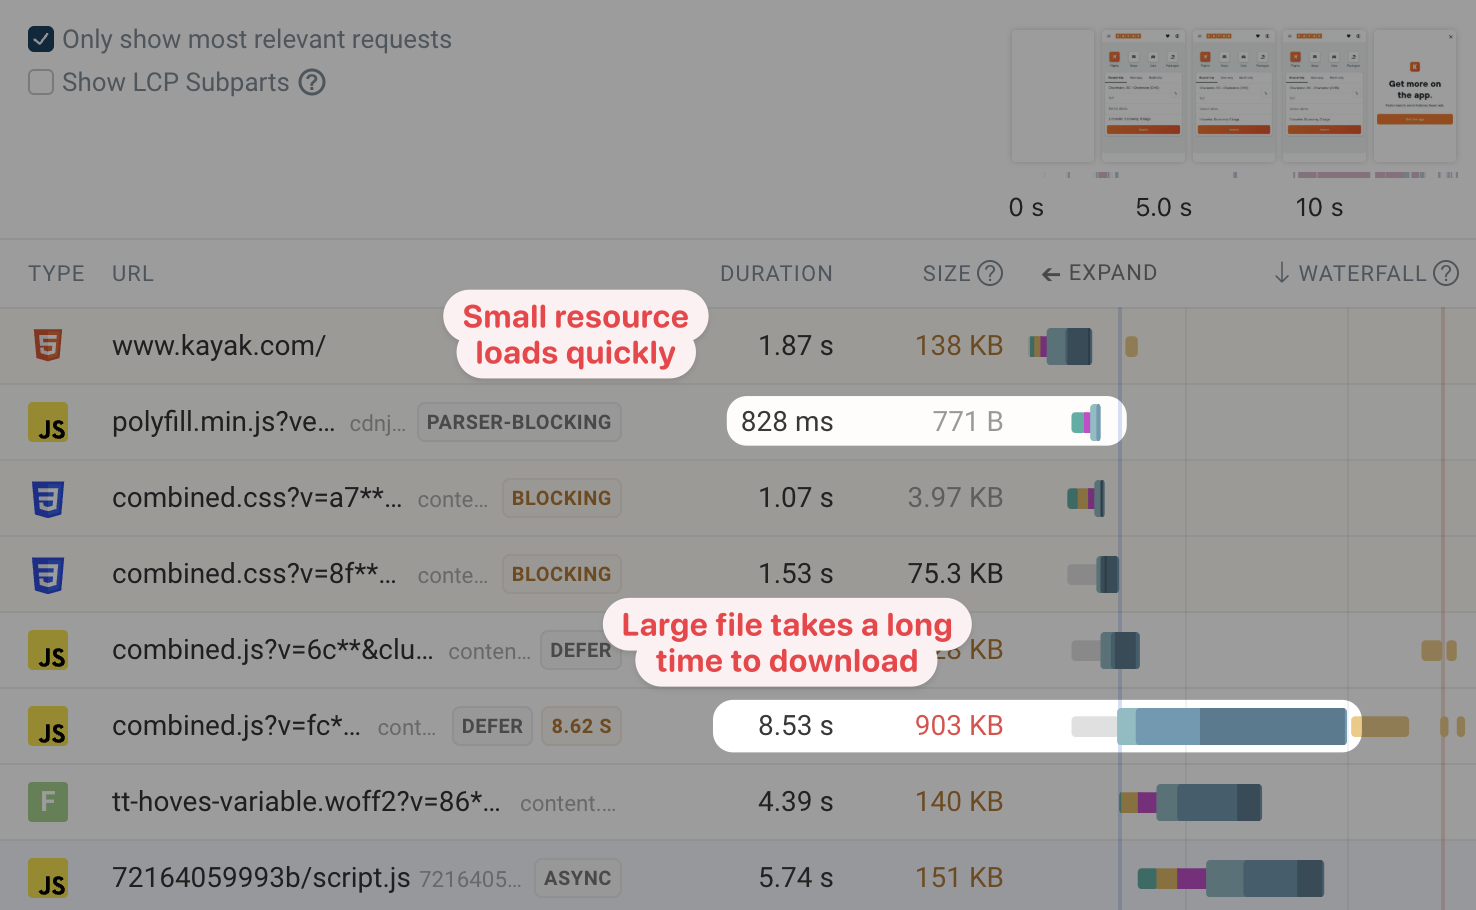
The darker shaded areas of the download duration bar indicate when data chunks arrive for this resource.
The arrival of different data chunks depends on how the browser and server handle HTTP prioritization.
Request details
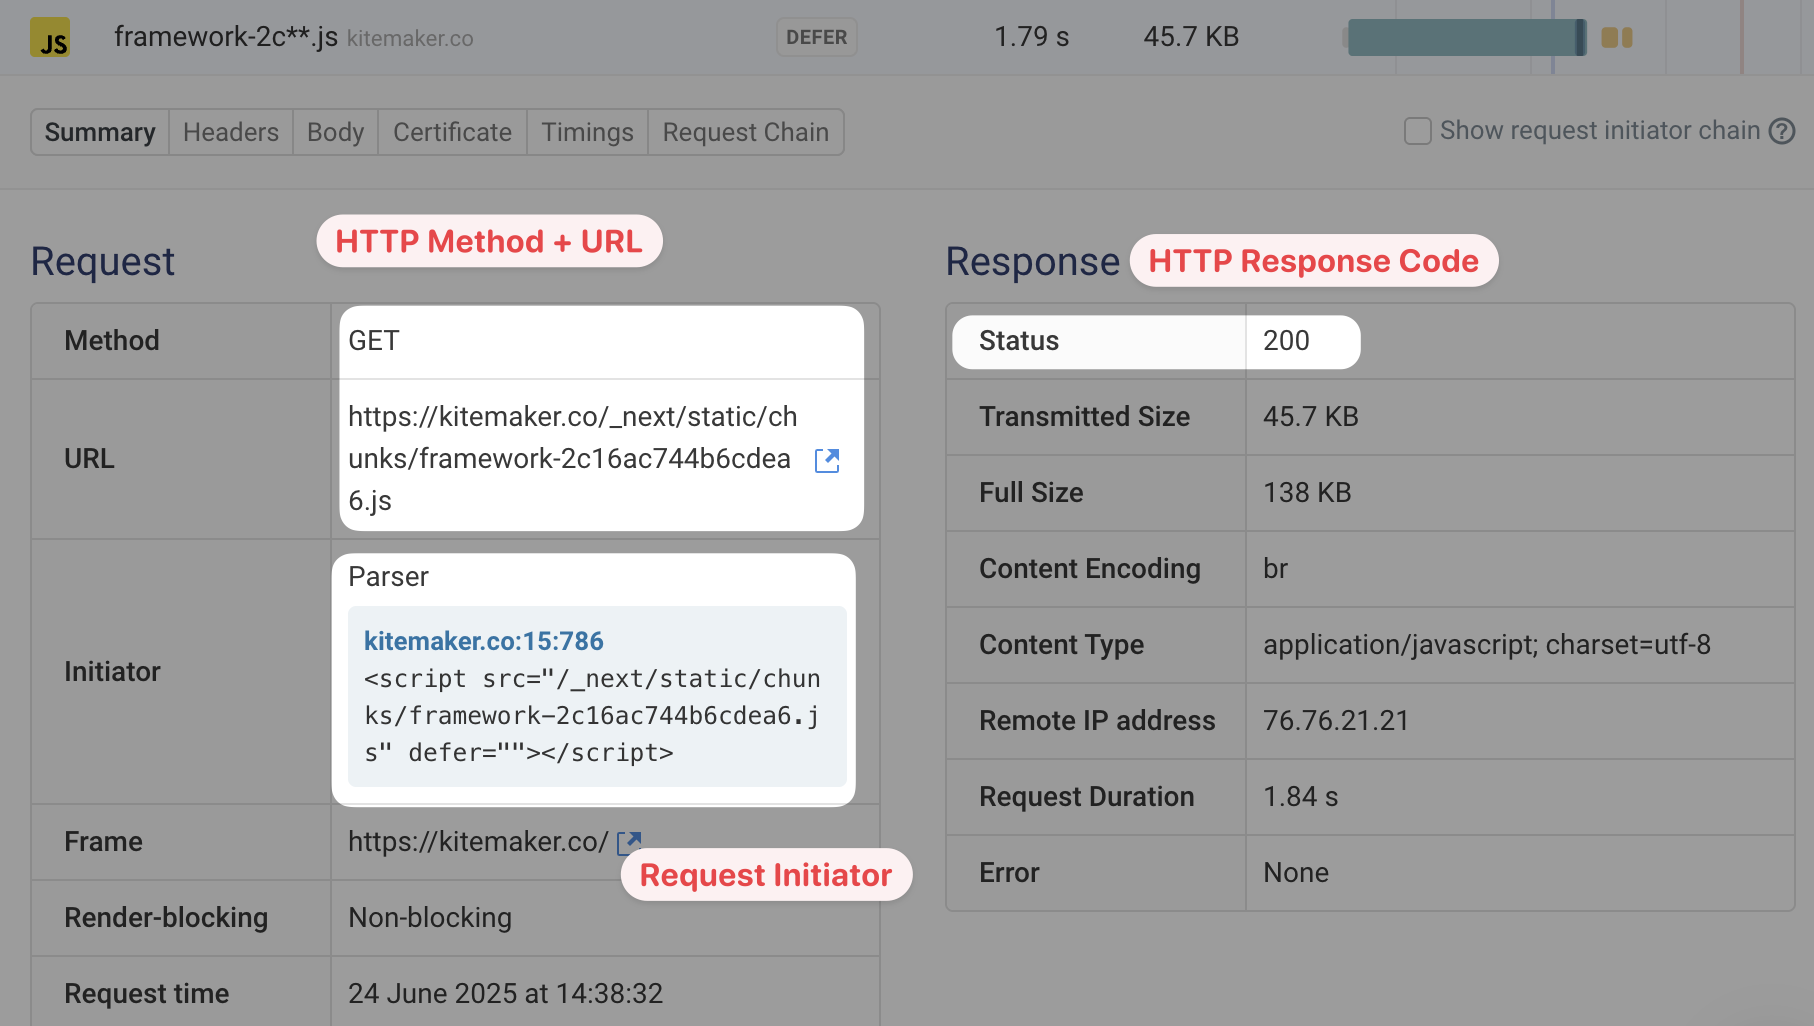
You can expand each request in the waterfall view to reveal additional details, for example:
- The full HTTP request URL and method
- What triggered the request (the request initiator)
- The HTTP response status
HTTP request and response headers
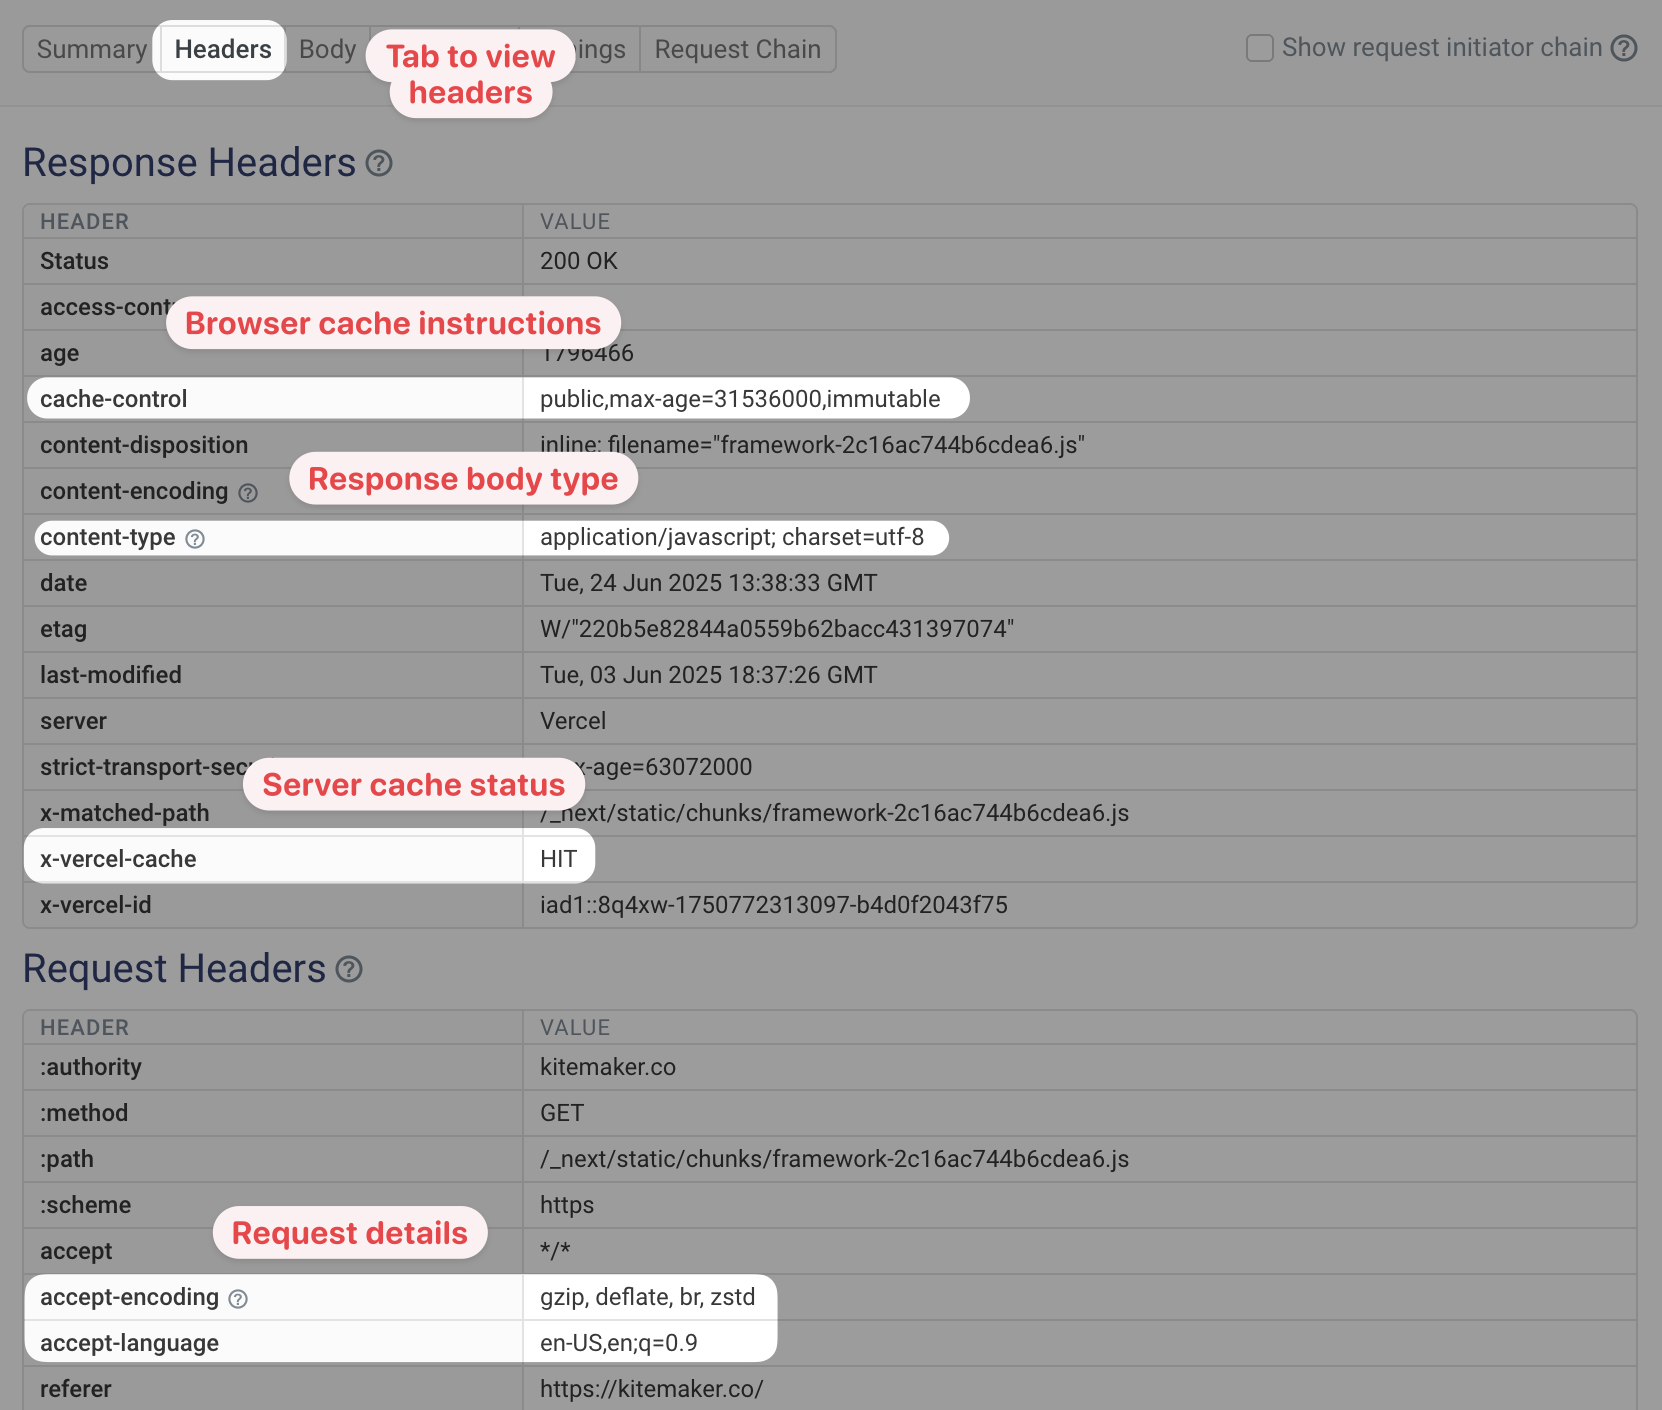
After expanding a request you can switch to the Headers tab to view what request headers were sent by the browser and what headers were provided as part of the server response.
For example, you can see how the browser should cache the response by looking at the cache-control header.
Response body and size analysis
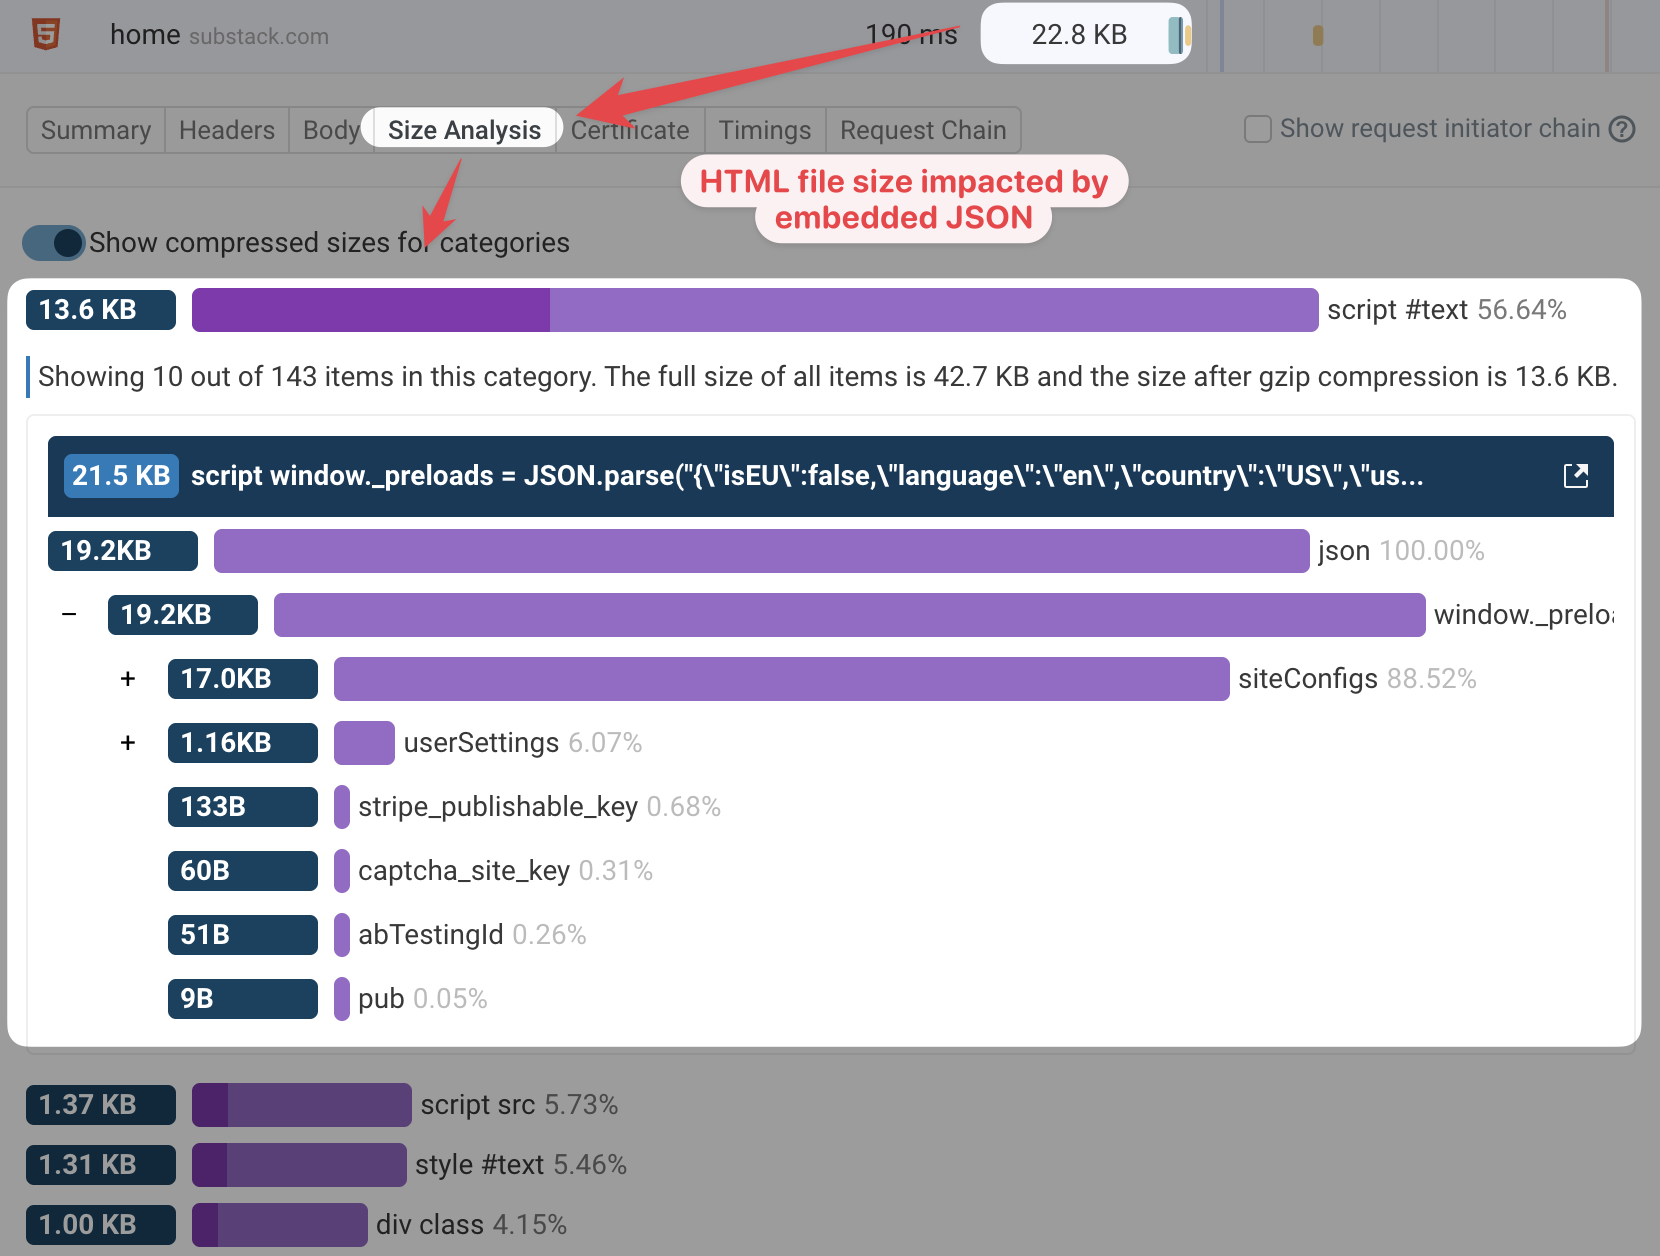
If you see a large HTML or CSS response you can also use the Size Analysis feature to inspect the resource in more detail.
For example, here you can see that a large part of the HTML code is actually a <script> tag with JSON in it.
Monitor and optimize your Core Web Vitals
DebugBear offers in-depth performance testing with a detailed request waterfall, custom performance recommendations, and an experiments feature to try optimizations without changing production code.
You can track your page speed over time using scheduled tests, monitor data from Google's Chrome User Experience Report (CrUX), and collect real user web performance analytics.


Monitor Page Speed & Core Web Vitals
DebugBear monitoring includes:
- In-depth Page Speed Reports
- Automated Recommendations
- Real User Analytics Data