Now you can your website's slowest URLs, spot changes in pageviews, create multi-metric graphs, and check caching headers in waterfall charts.
Find the pages on your website that most need optimising
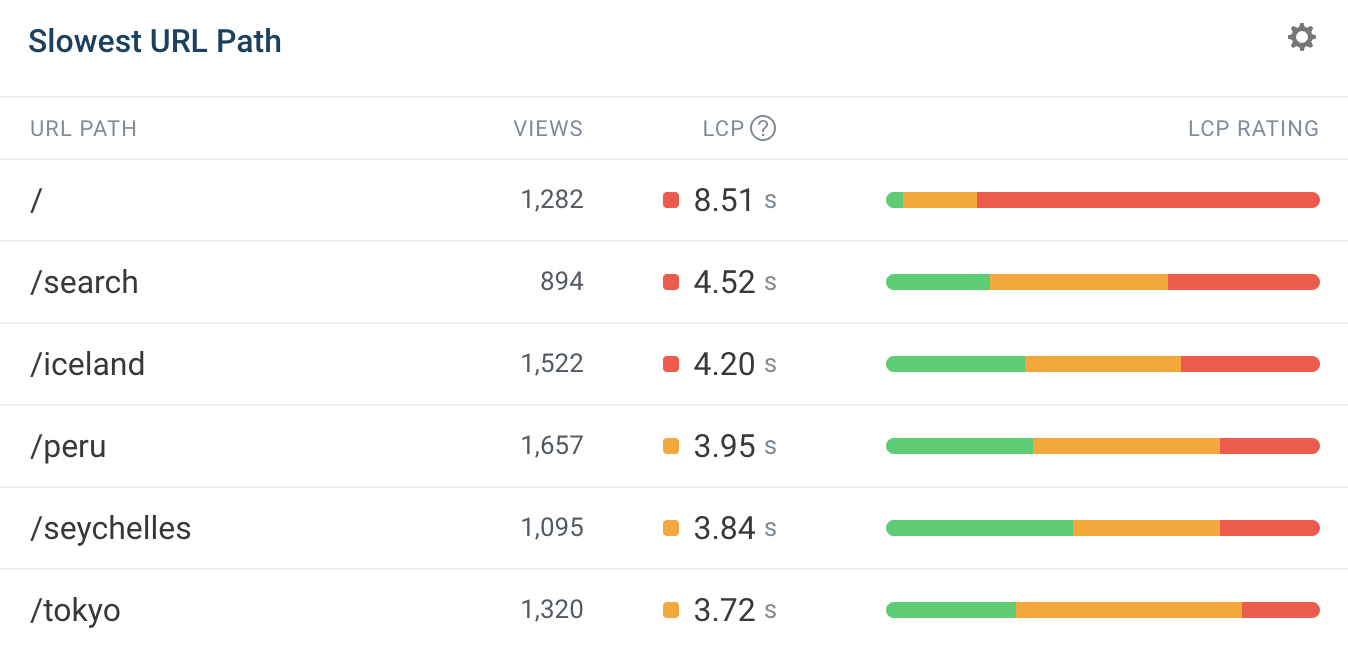
When it comes to improving site performance, fixing your worst URLs is likely a priority. That's why the Largest Contentful Paint page now presents a list of your slowest URLs, to help you identify the pages that might most benefit from optimization work.
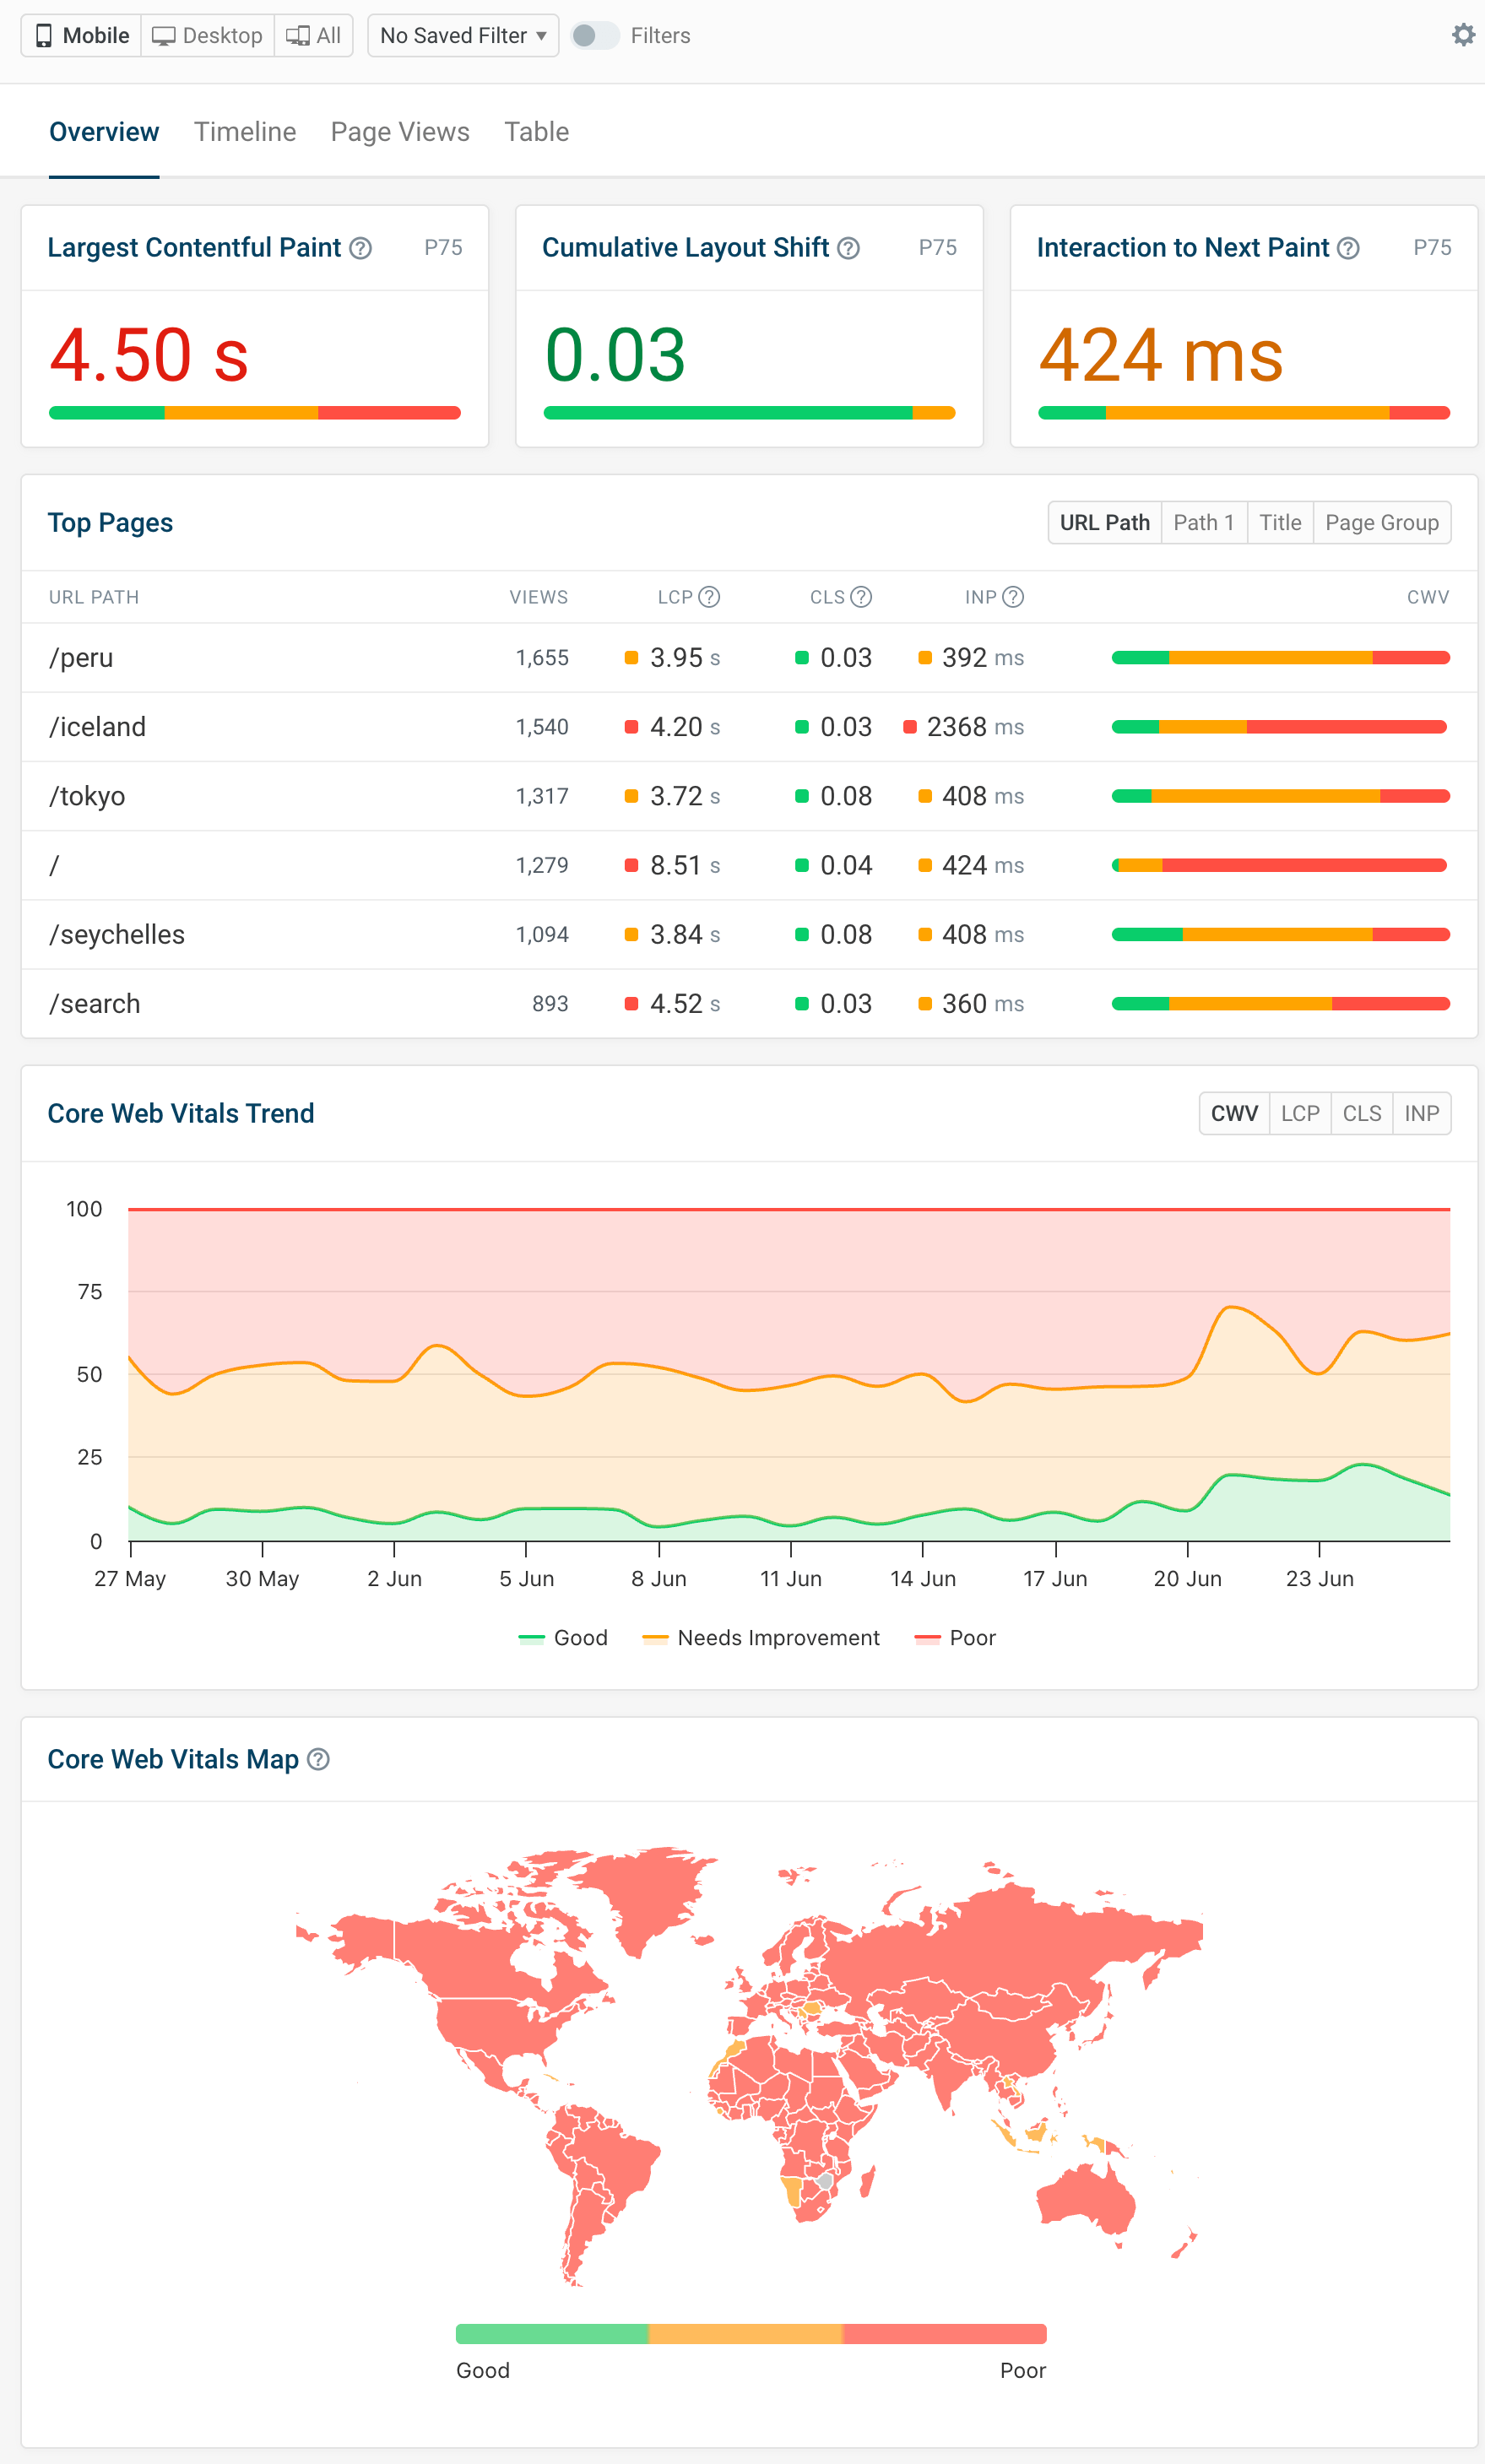
We've made also some aesthetic updates to our Real User Monitoring dashboards, to make them that little bit easier to understand.
Spot changes in page view count
In Real User Monitoring, we now call out changes in pageviews when you use the Compare view, which you can activate with the slider in the top-right.
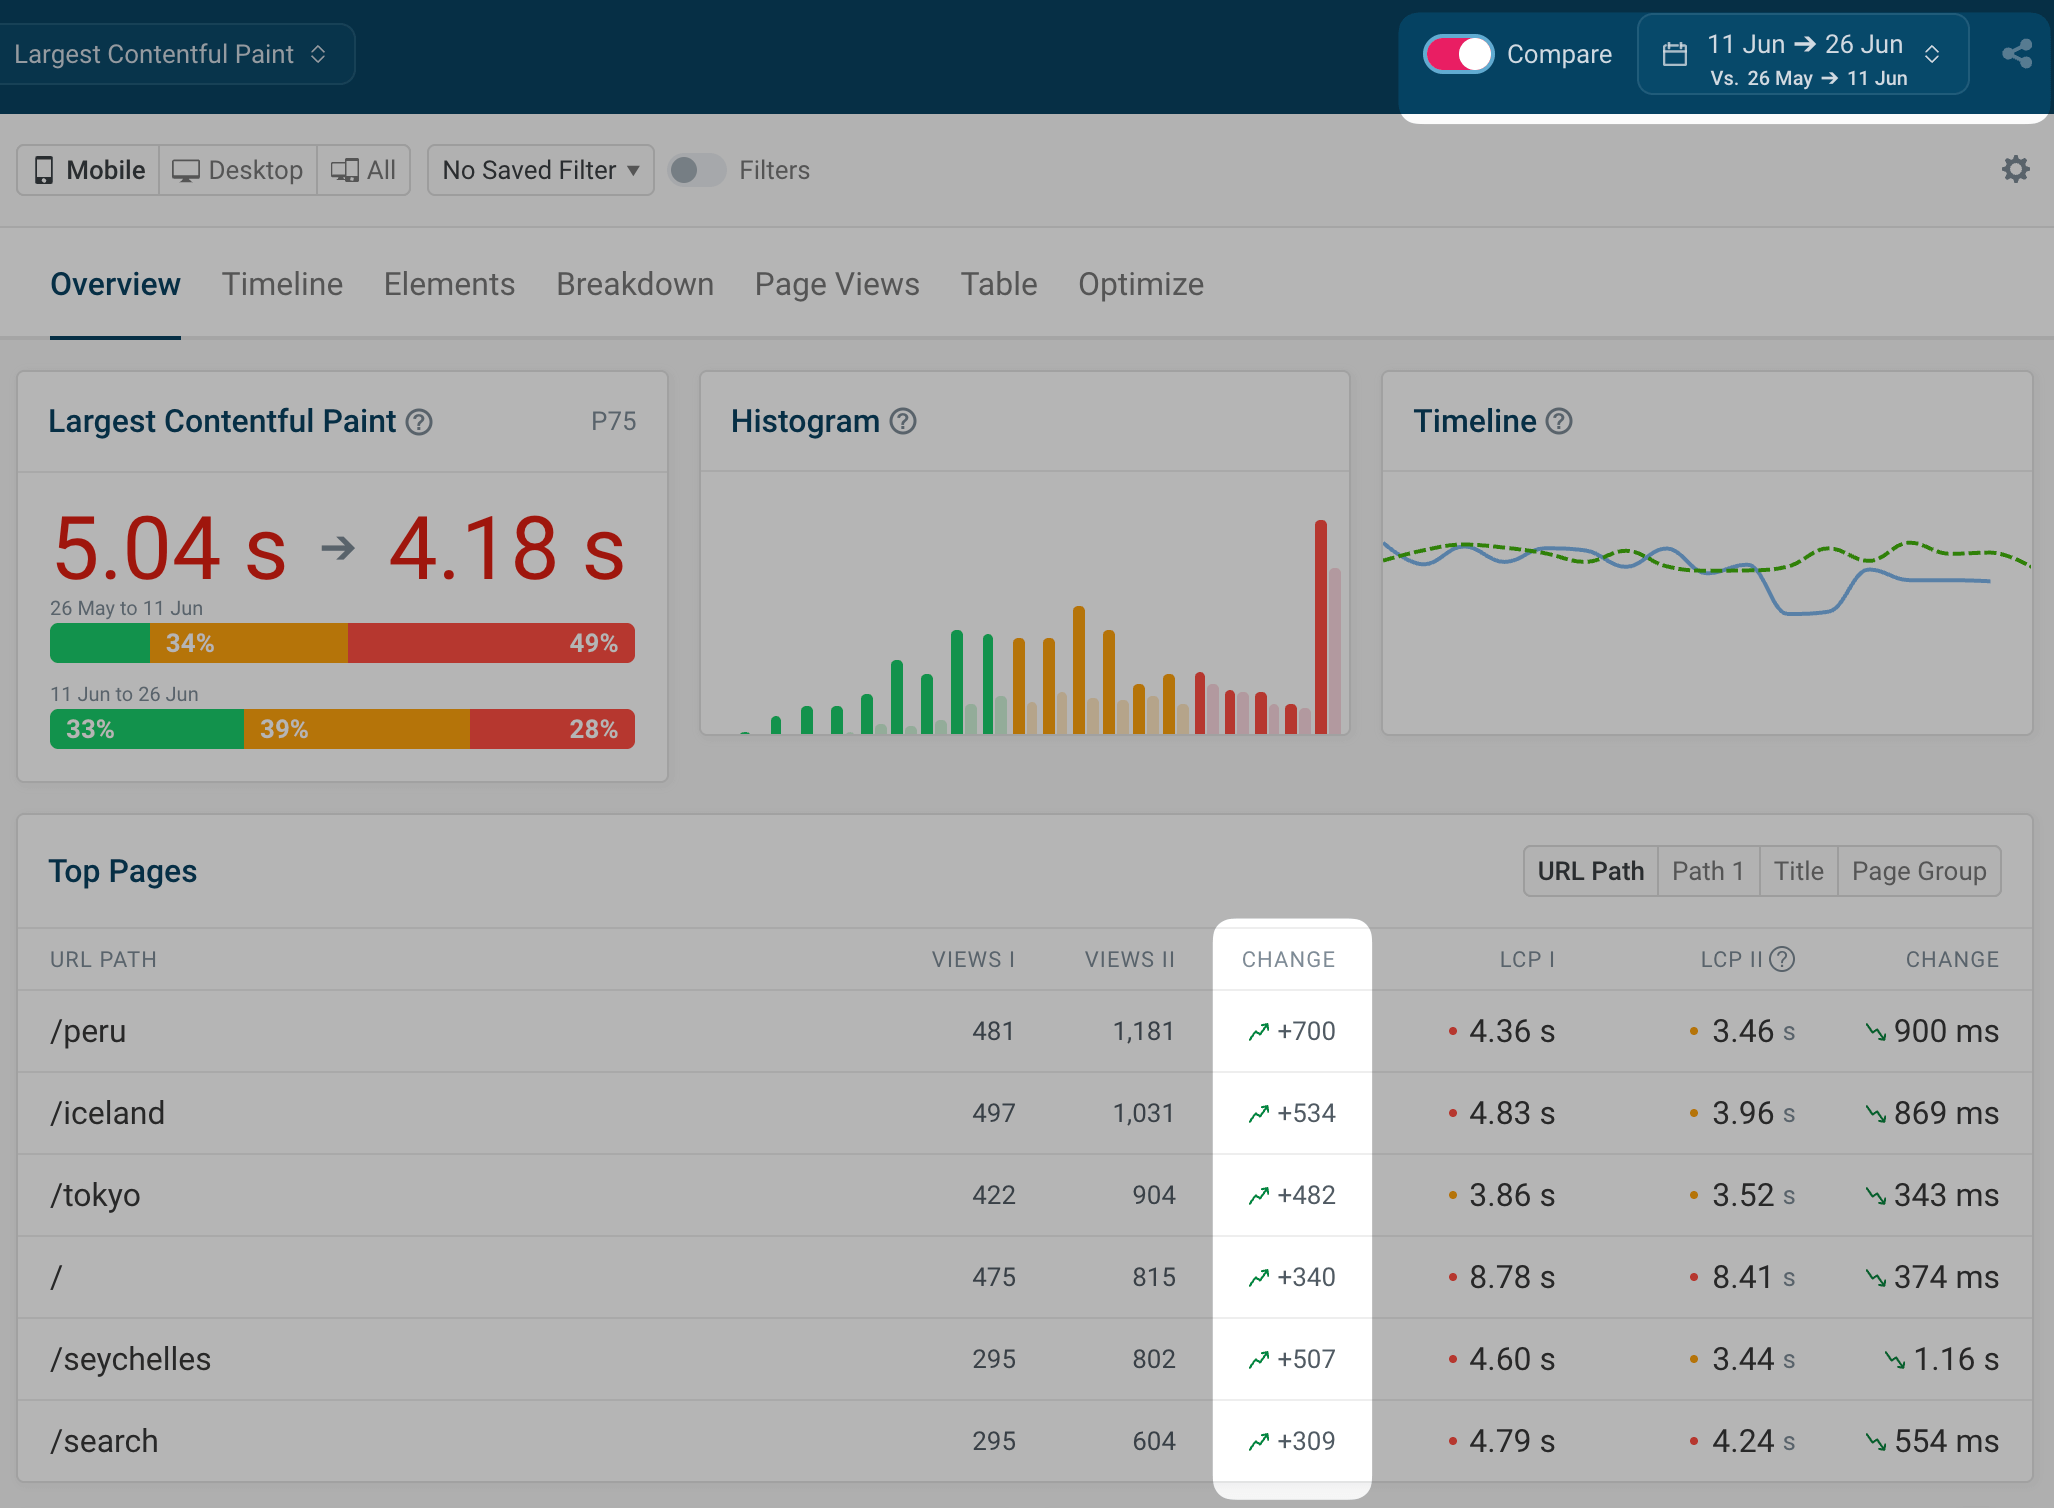
A significant increase here might indicate a new audience visiting your site (perhaps from new locations, or with different devices) or an increased server load, either of which might affect your real-life page load time.
See how your assets are cached in lab tests
In our lab test waterfall charts, you can now hover over any item and see how it's been cached, based on the headers of the HTTP response, right in the tooltip.
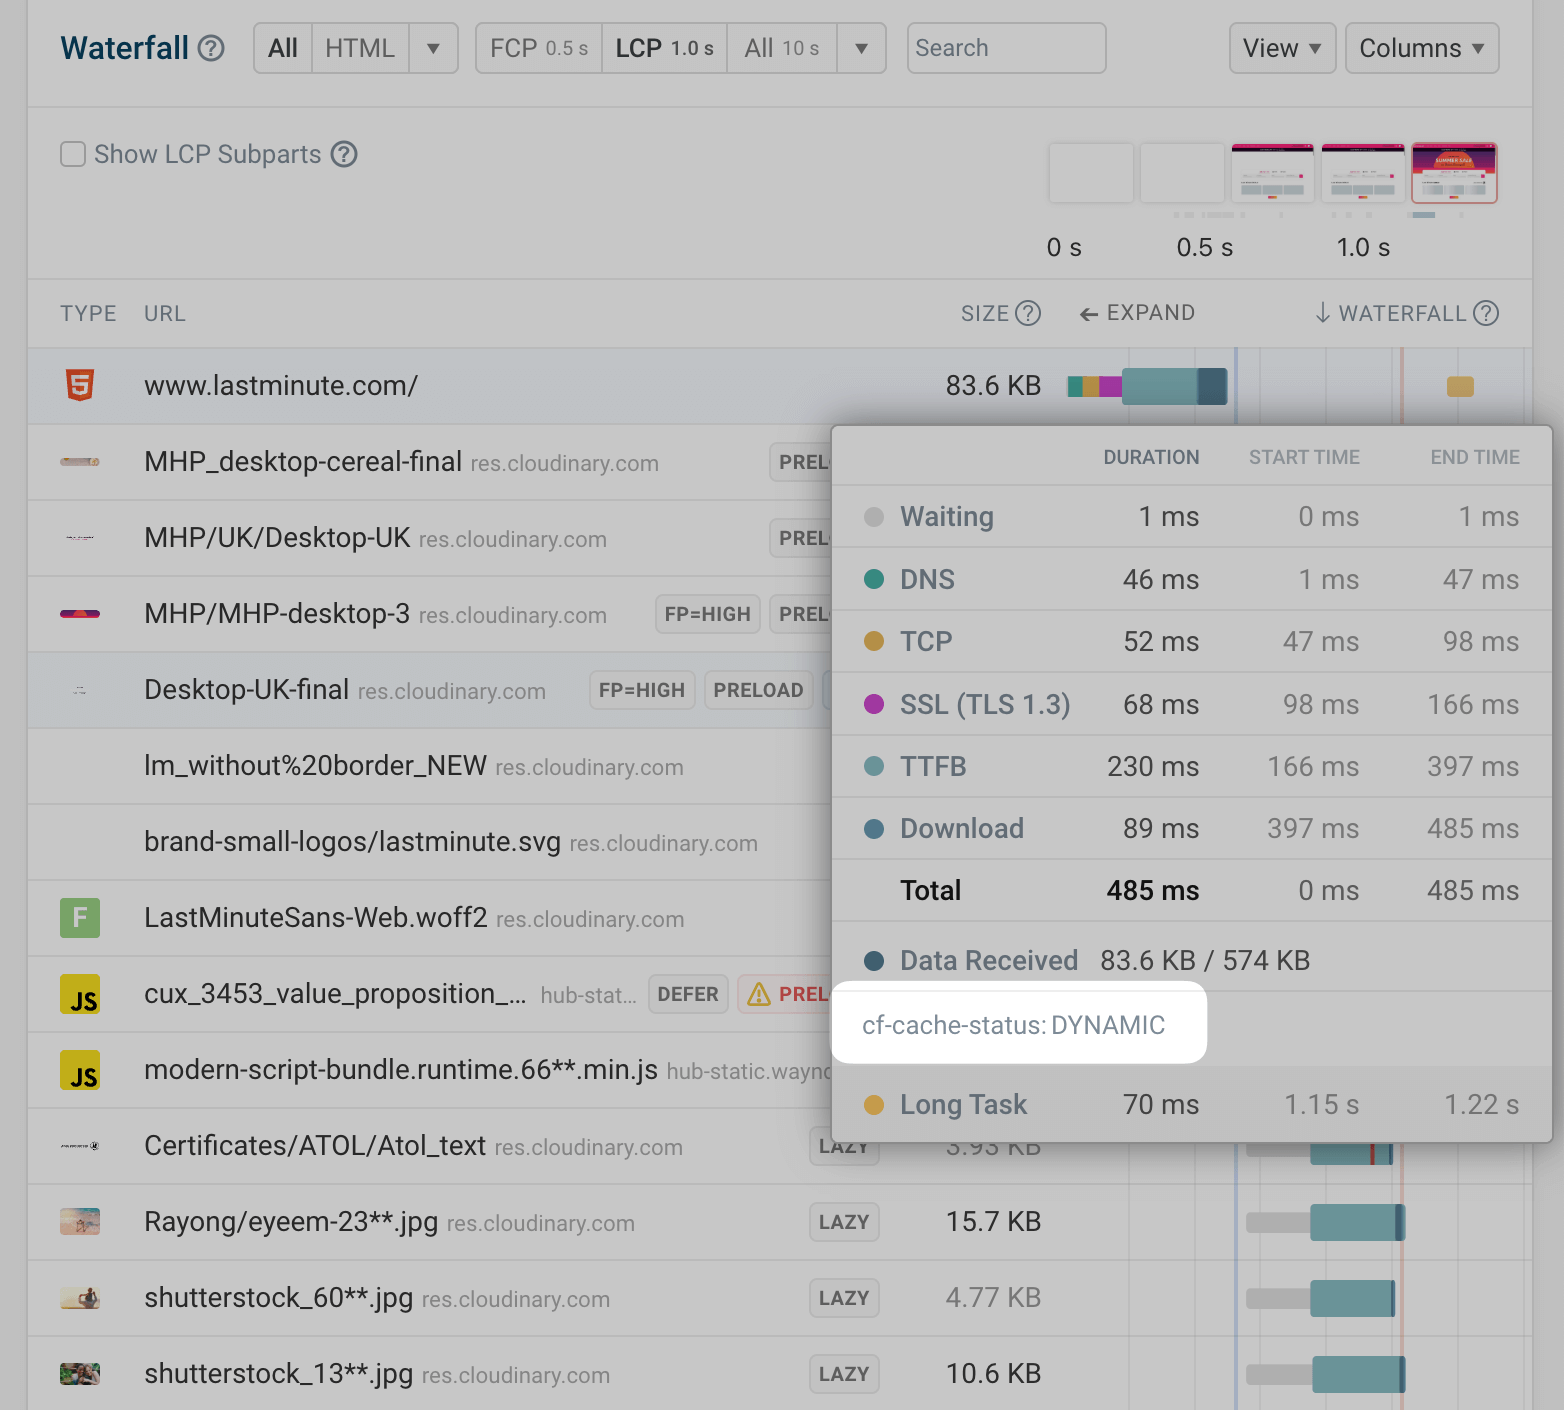
This helps you ensure your caching solution is working as you'd expect.
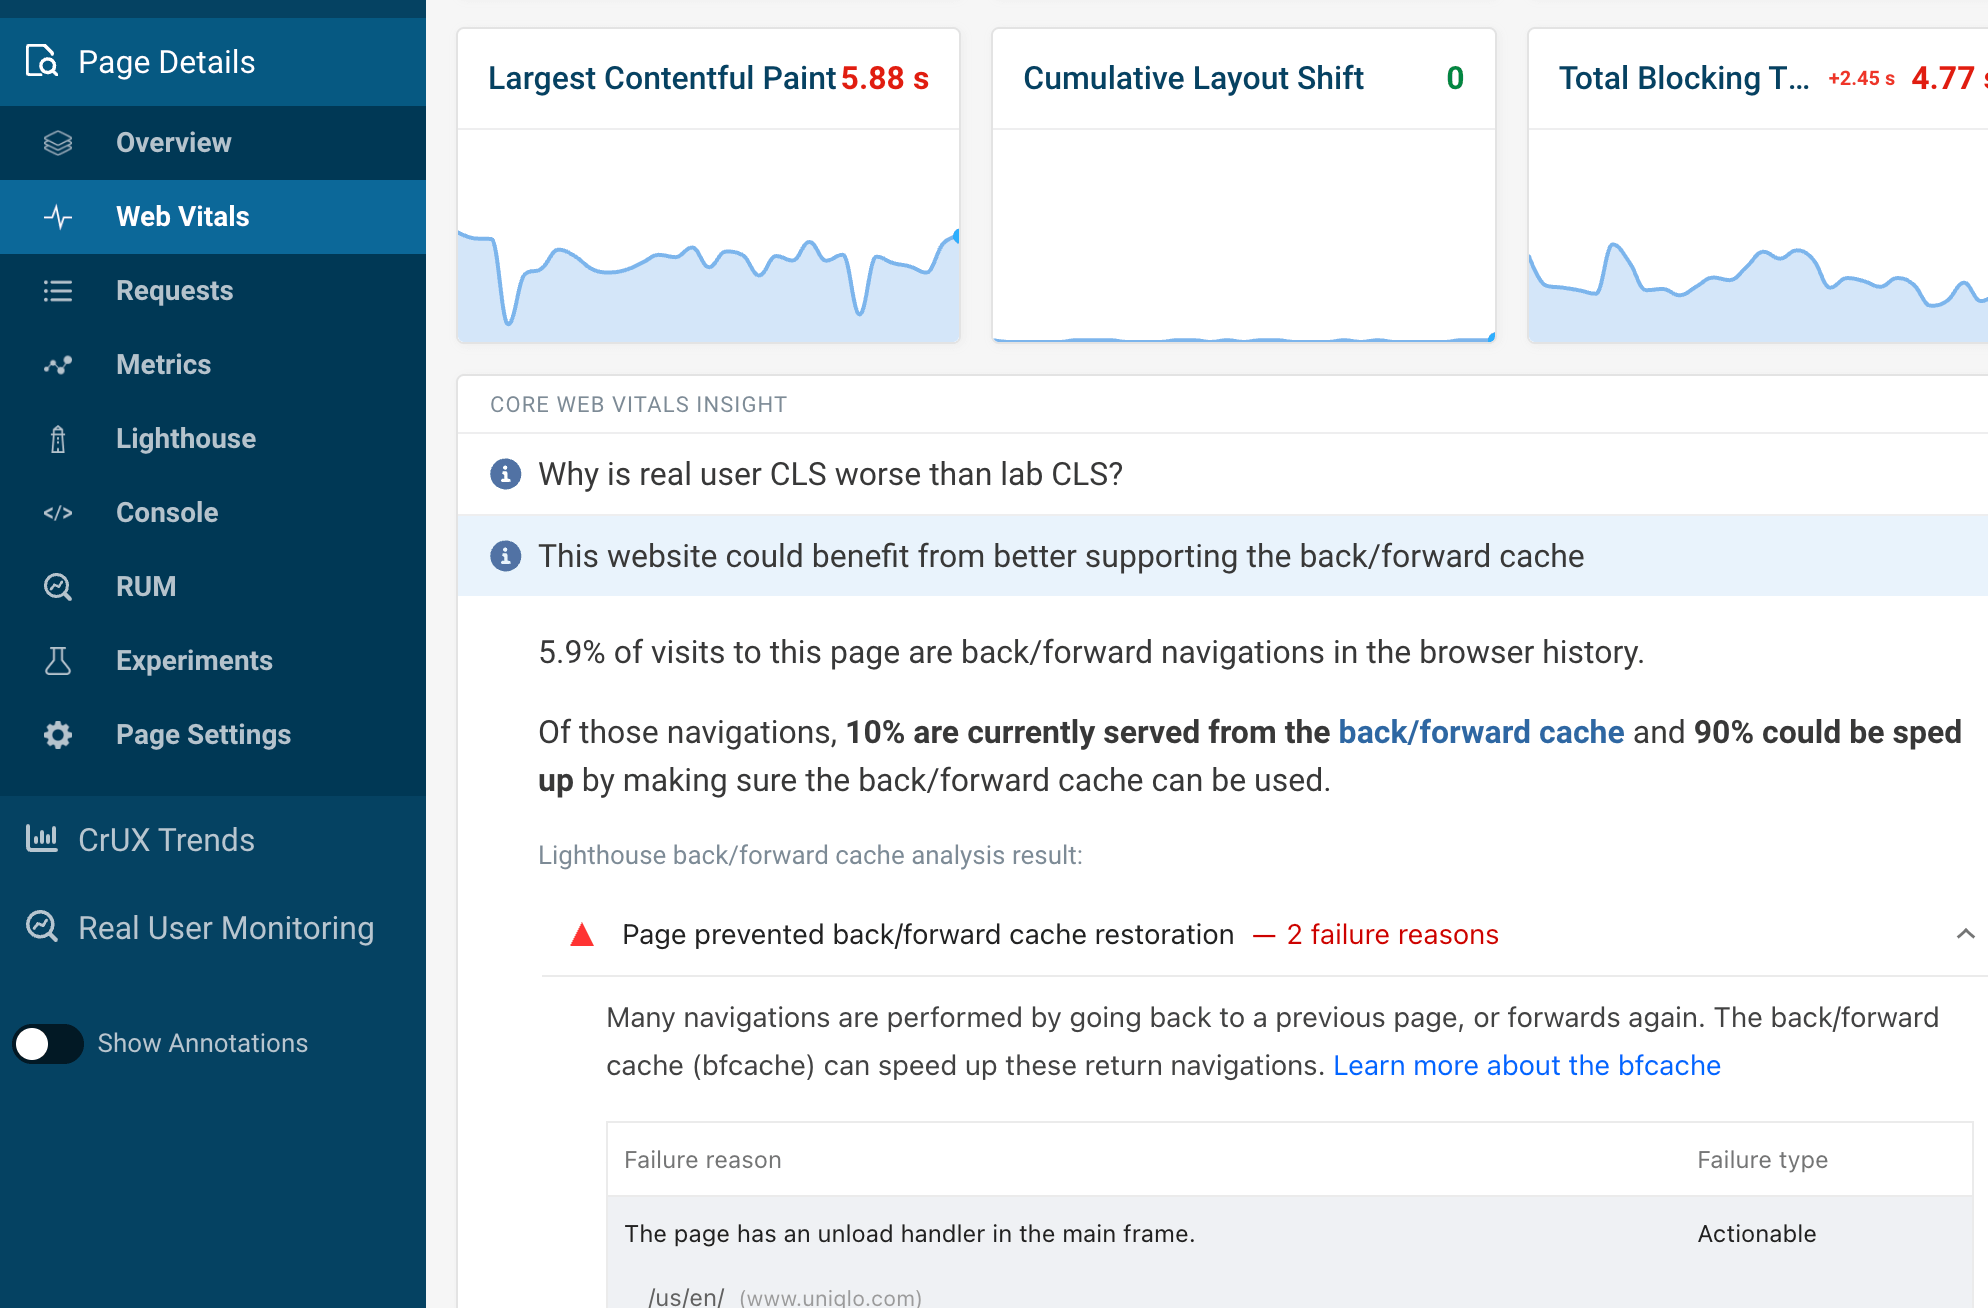
Recommendations for using the back/forward cache
When users visit your page, navigate onwards, but then hit 'back', the second pageload should be almost instant. But for various reasons, this often isn't true. If your page has a high number of 'back' users who are reloading the page rather than displaying a cached version, you'll see additional guidance in the Web Vitals view for that page.
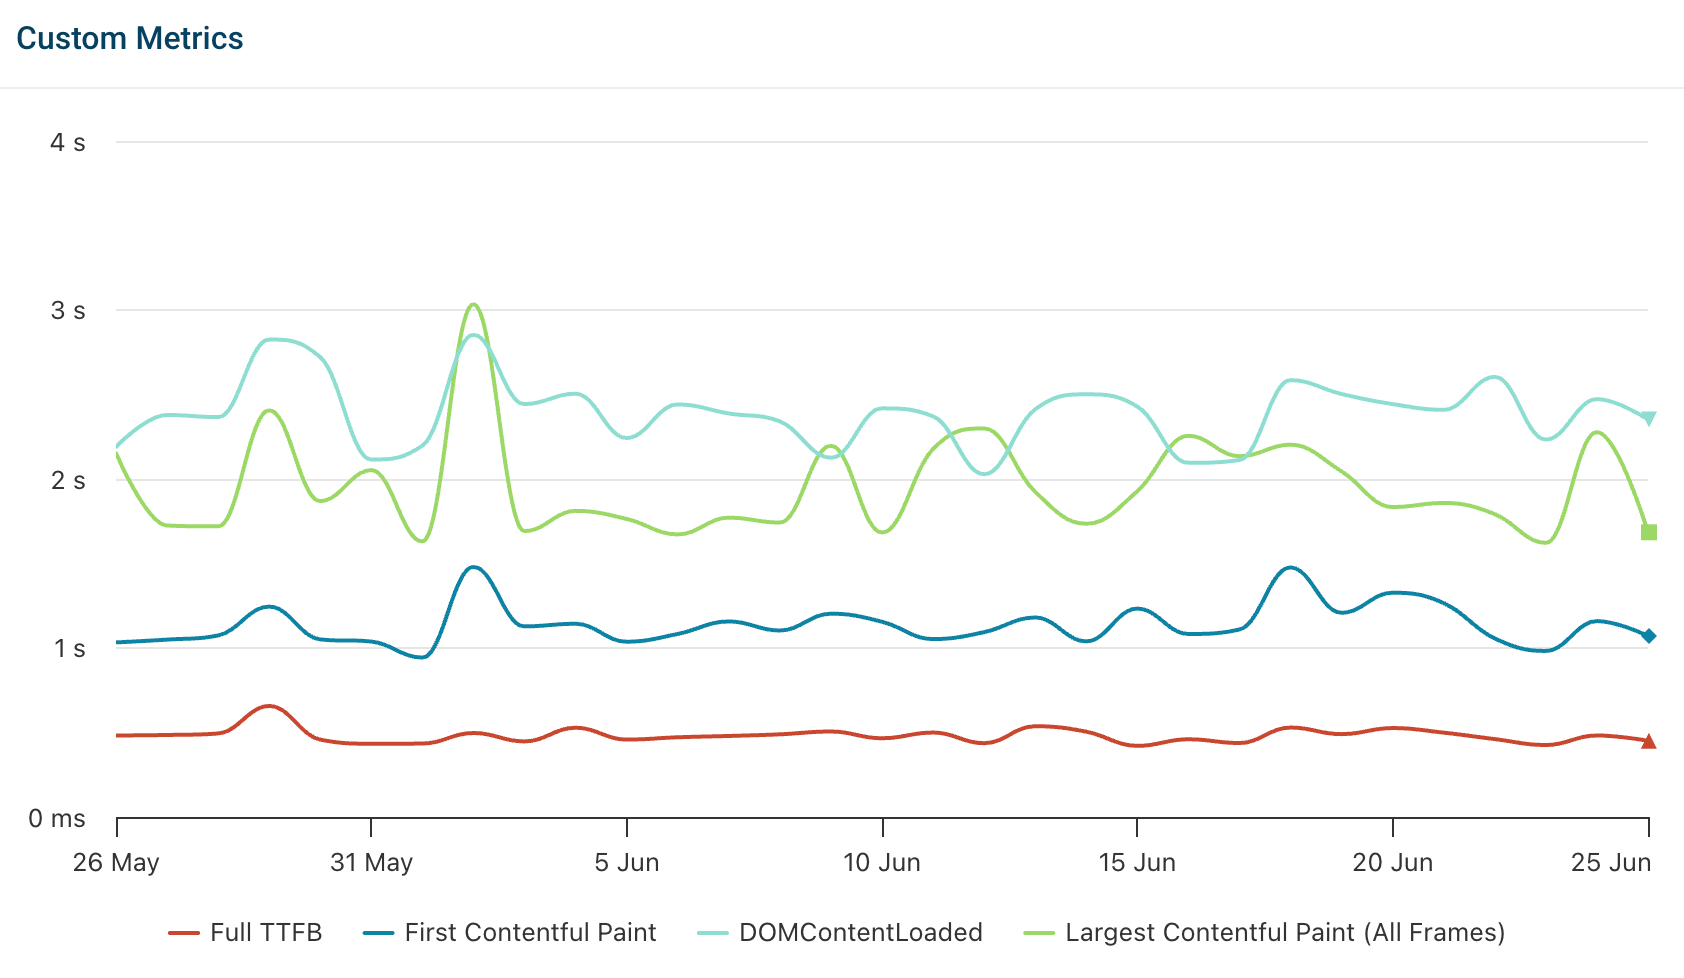
Monitor multi-metric charts for the numbers that matter to you
It's now easier to generate charts that display all the metrics you want to track. In Lab Tests → (your URL) → Metrics, use the metrics dropdown to select from our pre-designed families of metrics, add your own at the bottom, or choose from a custom group of metrics you've previously saved.
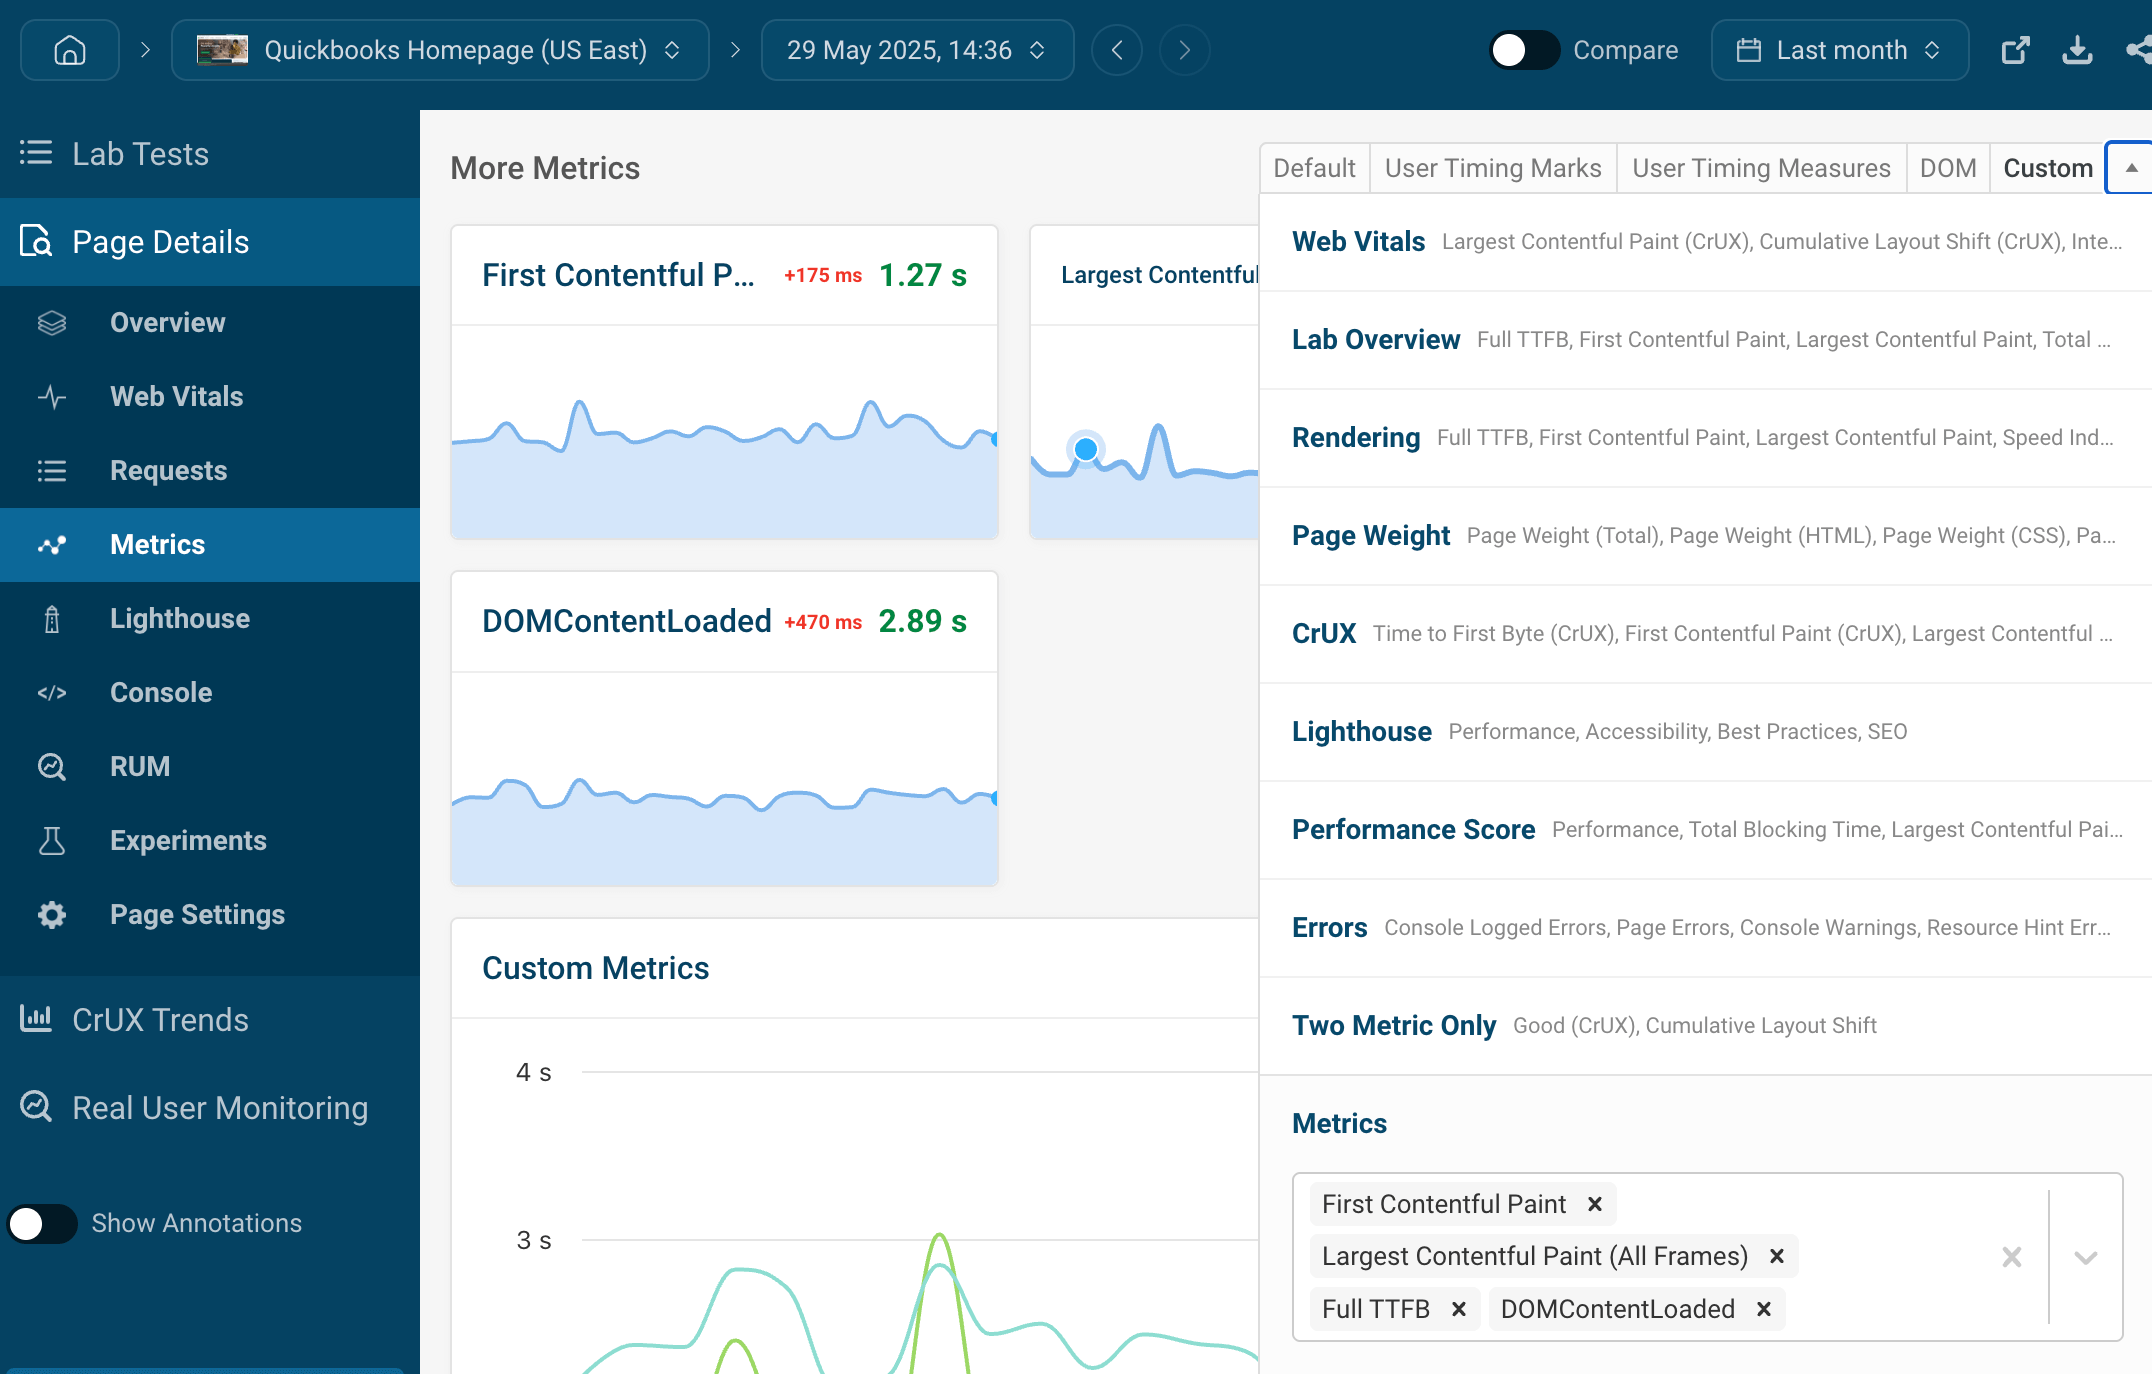
These will then all be presented together in the Combined Metrics chart.
Updated with all the latest releases
Our tests now use Chrome 137 and version 5 of web-vitals.js.
Raise your performance game with our latest articles & videos
New articles on our blog:
- Website INP Scores In 2025: UX Impact Across The World. We take a look at how quickly sites respond to user input in different territories.
- How To Use The Browser Console: An In-Depth Guide A deep dive into the powerful DevTools console in Google Chrome, from the basics through to the more advanced features.
And new videos on our Youtube channel:
Check out our video guide to the speed index metric and how to improve it:
We've also been busy creating helpful videos that empower you to get the most out of DebugBear: